Data
Note: With the current Season I want to start using a “more robust” way for which games to collect. Reason being that while I want to focus on Master players it’s possible to notice the flaw that
Once a player reached Master he/she stops playing so it’s equal to be non-existent for the analysis
As of now, without an incentive to climb the Master leaderboard is less populated and yet it’s not like all those lowers are probably that much worse. I noticed for example that the data from the Master of the previous Season still had very similar results regarding win rates. But using the “last-Season” masters is also quite an unstable way to pick the players/games.
So the proposed solution is the following:
Collect Master Data as usual
Collect games from HighDiamond players. With “HighDiamond defined as those who played against a Master but aren’t”. Of course if a Diamond reaches Master I stop collecting his/her games as Diamond but start as Master. This may also help to create some analysis based on “skills”
For the early weeks of a Season I’m going to collect the games from those who played the Seasonal tournament (of course this is assuming it’s held each season which is a safe approach I guess). If I should show all the results or either LastSeasonal/Diamond or Master/Diamond is something I still have to decide. Adding more stuff can be fine but the report is already big like this.
Number of (Ranked) matches analysed 3277 or 6554 games. / LastSeasonal Players
Number of (Ranked) matches analysed 23335 or 46670 games. / ~HighDiamond
Last Update: 2022-02-05 19:44
| Patch 2.21 - Week 1 - by the Numbers1 | ||||
|---|---|---|---|---|
| Characteristic2 | Last Seasonal | ~HighDiamond | ||
| N = 15,8313 | N = 3,2773 | N = 55,3543 | N = 23,3353 | |
| Status | ||||
| Friendly | 11,949 (75%) | 15,557 (28%) | ||
| Ranked | 3,277 (21%) | 23,335 (42%) | ||
| Other | 605 (3.8%) | 2,392 (4.3%) | ||
| to Scrap | 14,070 (25%) | |||
| Server | ||||
| americas | 8,070 (51%) | 2,000 (61%) | 24,914 (45%) | 11,299 (48%) |
| apac | 3,757 (24%) | 415 (13%) | 14,371 (26%) | 3,717 (16%) |
| europe | 4,004 (25%) | 862 (26%) | 16,069 (29%) | 8,319 (36%) |
|
1
Max datetime recovered: 2021-12-15 17:59:55 UTC from 2021-12-08 18:00:00 to 2021-12-15 18:00:00 UTC
2
Metadata from Friendly Matches (that aren't Bo3) is not recoverable,
the value may not be perfect since I lack the starting time of the game. The amount of Games to still scrap is also an estimation based on the 'position' of the game
3
n(%) took from the number of matches. When the data is analysed the size is double since we account each different player
|
||||
Regions
Play Rate
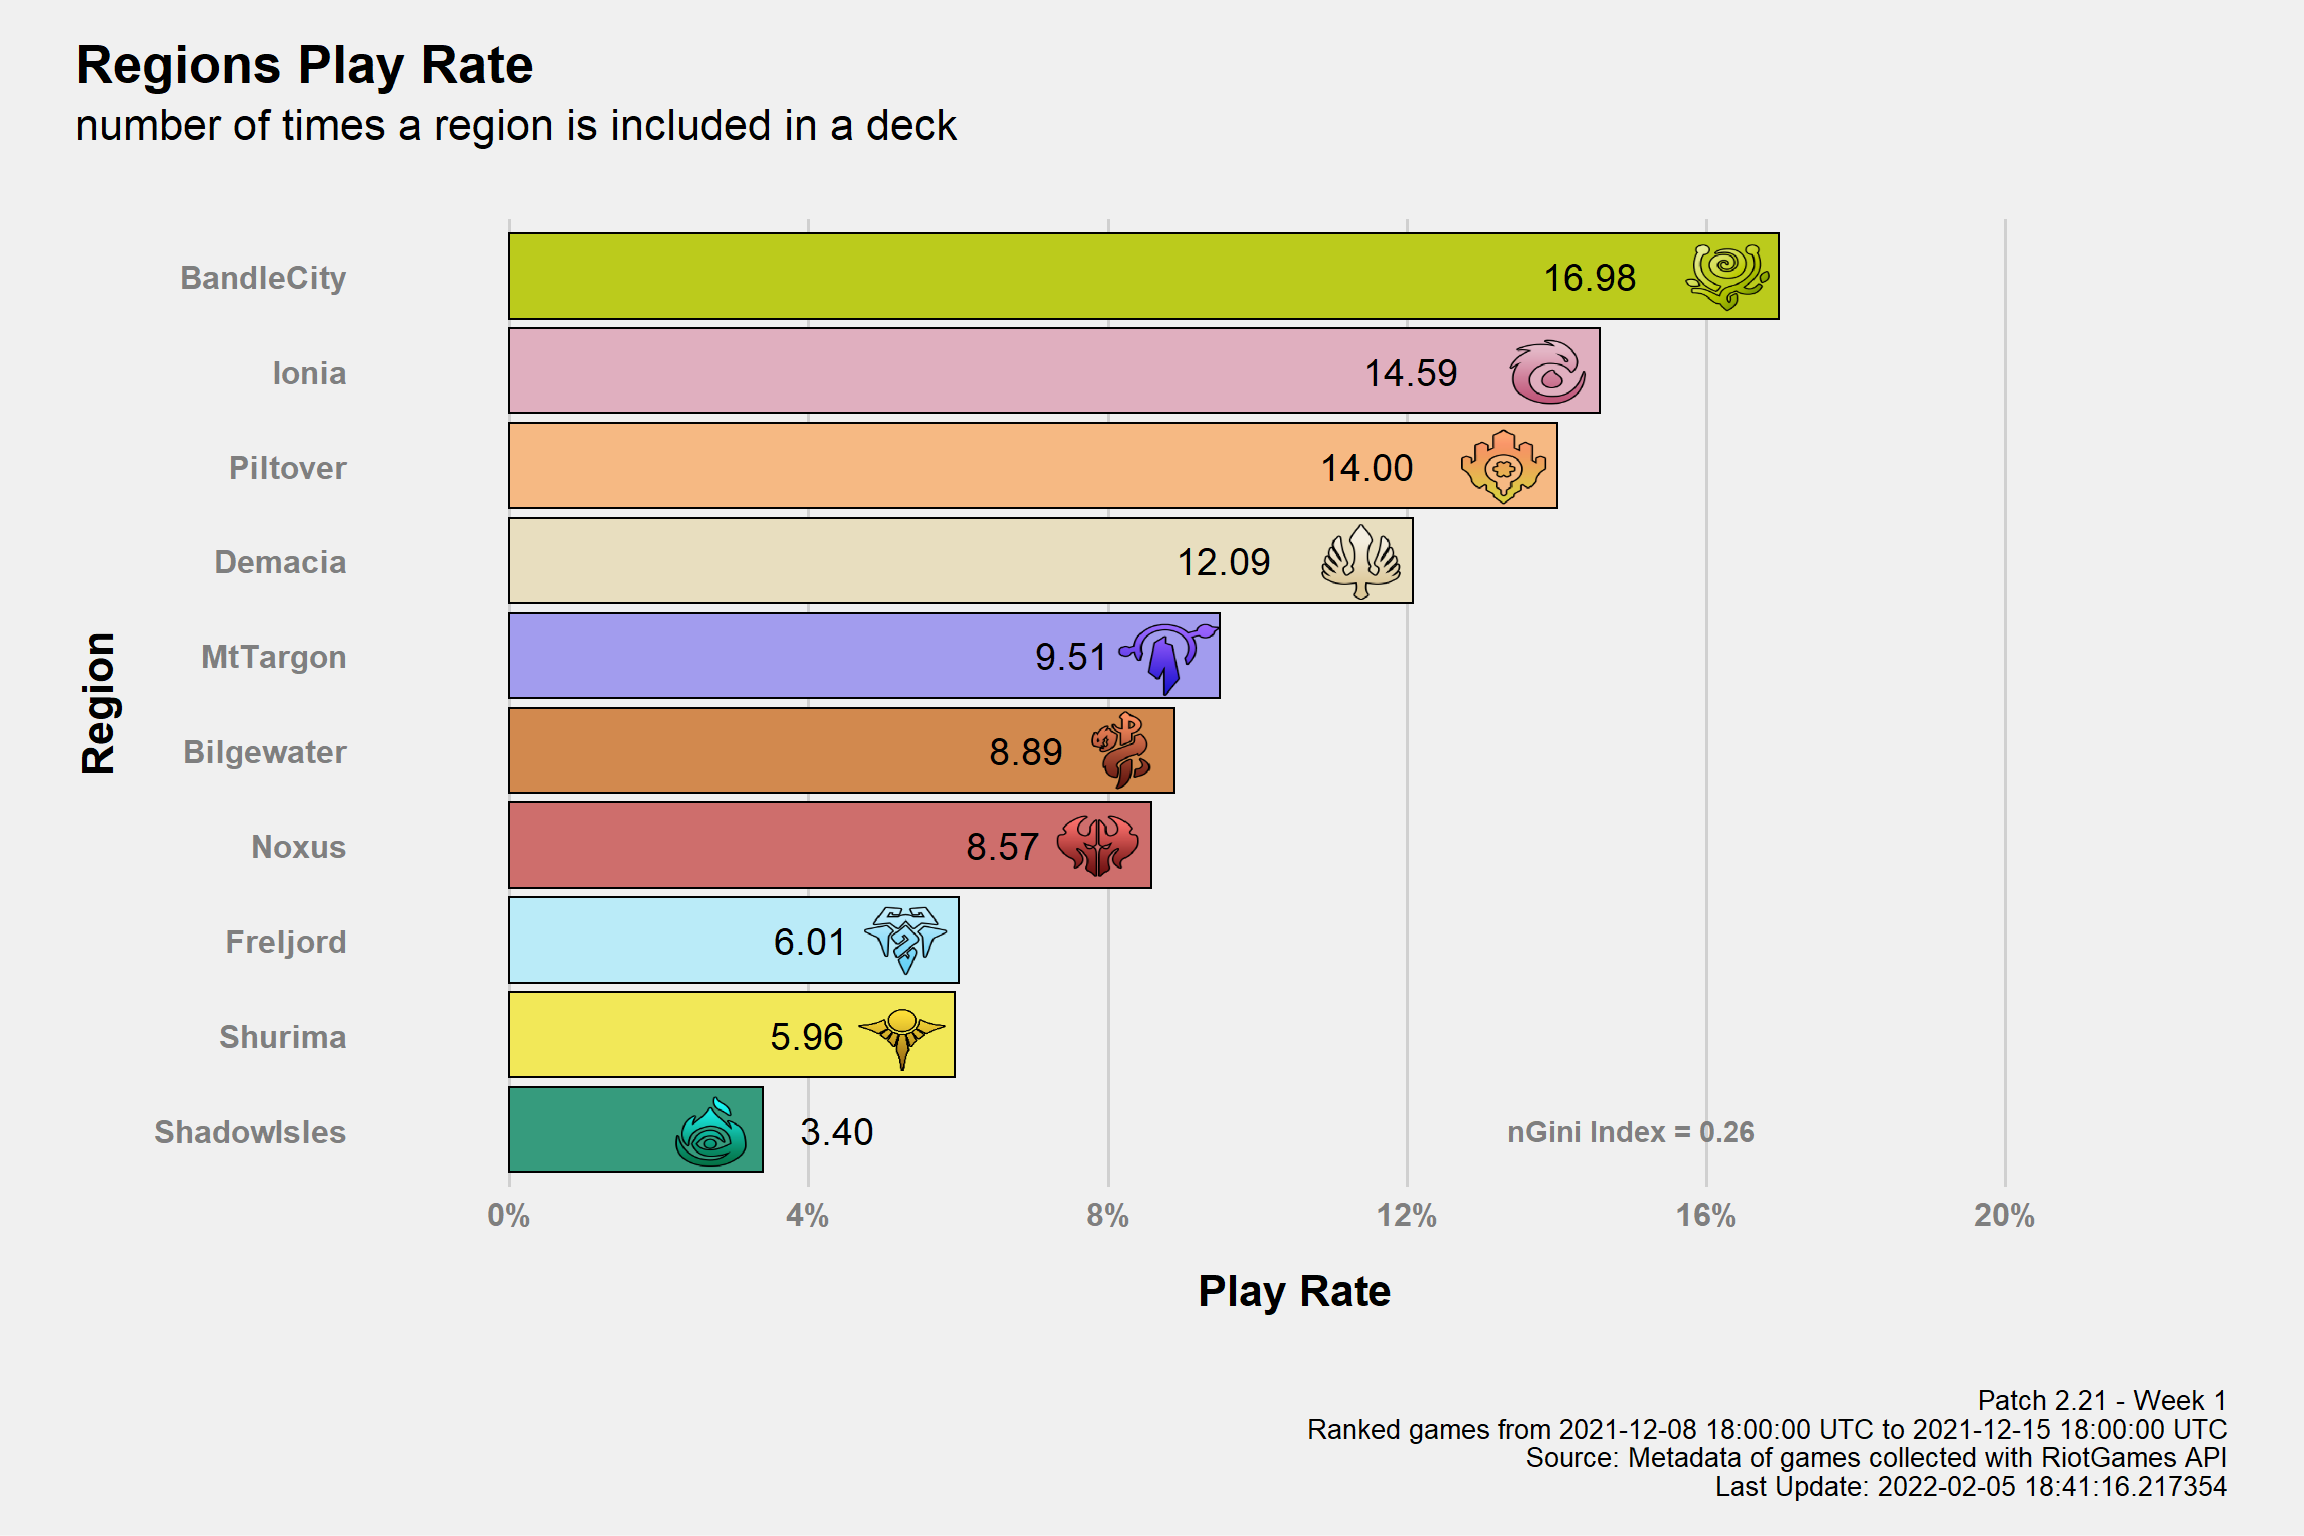
The Gini Index is a measure of heterogeneity so, in this case and in simpler terms, how much the play rates are similar. The Index goes (when normalized like here) in [0,1] and it’s equal to 1 when there’s a single value with 100% play rate or 0 when all play rates are equal. Of course a Gini Index of 1 needs to be avoided but it’s not like the aim should be 0. As said, it’s just to add some additional tools.
| Region Play Rate | ||||
|---|---|---|---|---|
| Relative Frequencies by Inclusion Rate of a Region | ||||
| Region | Freq | Shard | ||
| America | Apac | Europe | ||
| BandleCity | 16.98% | 16.12% | 21.29% | 16.90% |
| Ionia | 14.59% | 13.18% | 18.46% | 16.00% |
| Piltover | 14.00% | 13.07% | 17.07% | 14.69% |
| Demacia | 12.09% | 13.27% | 11.16% | 9.79% |
| MtTargon | 9.51% | 9.95% | 6.33% | 9.99% |
| Bilgewater | 8.89% | 9.55% | 5.43% | 9.03% |
| Noxus | 8.57% | 8.77% | 6.63% | 9.06% |
| Freljord | 6.01% | 5.99% | 5.31% | 6.39% |
| Shurima | 5.96% | 6.20% | 6.69% | 5.05% |
| ShadowIsles | 3.40% | 3.89% | 1.63% | 3.11% |
| Patch 2.21 - Week 1 Ranked games from 2021-12-08 18:00:00 UTC to 2021-12-15 18:00:00 UTC Source: Metadata of games collected with RiotGames API Last Update: 2022-02-05 18:41:16.217354 | ||||
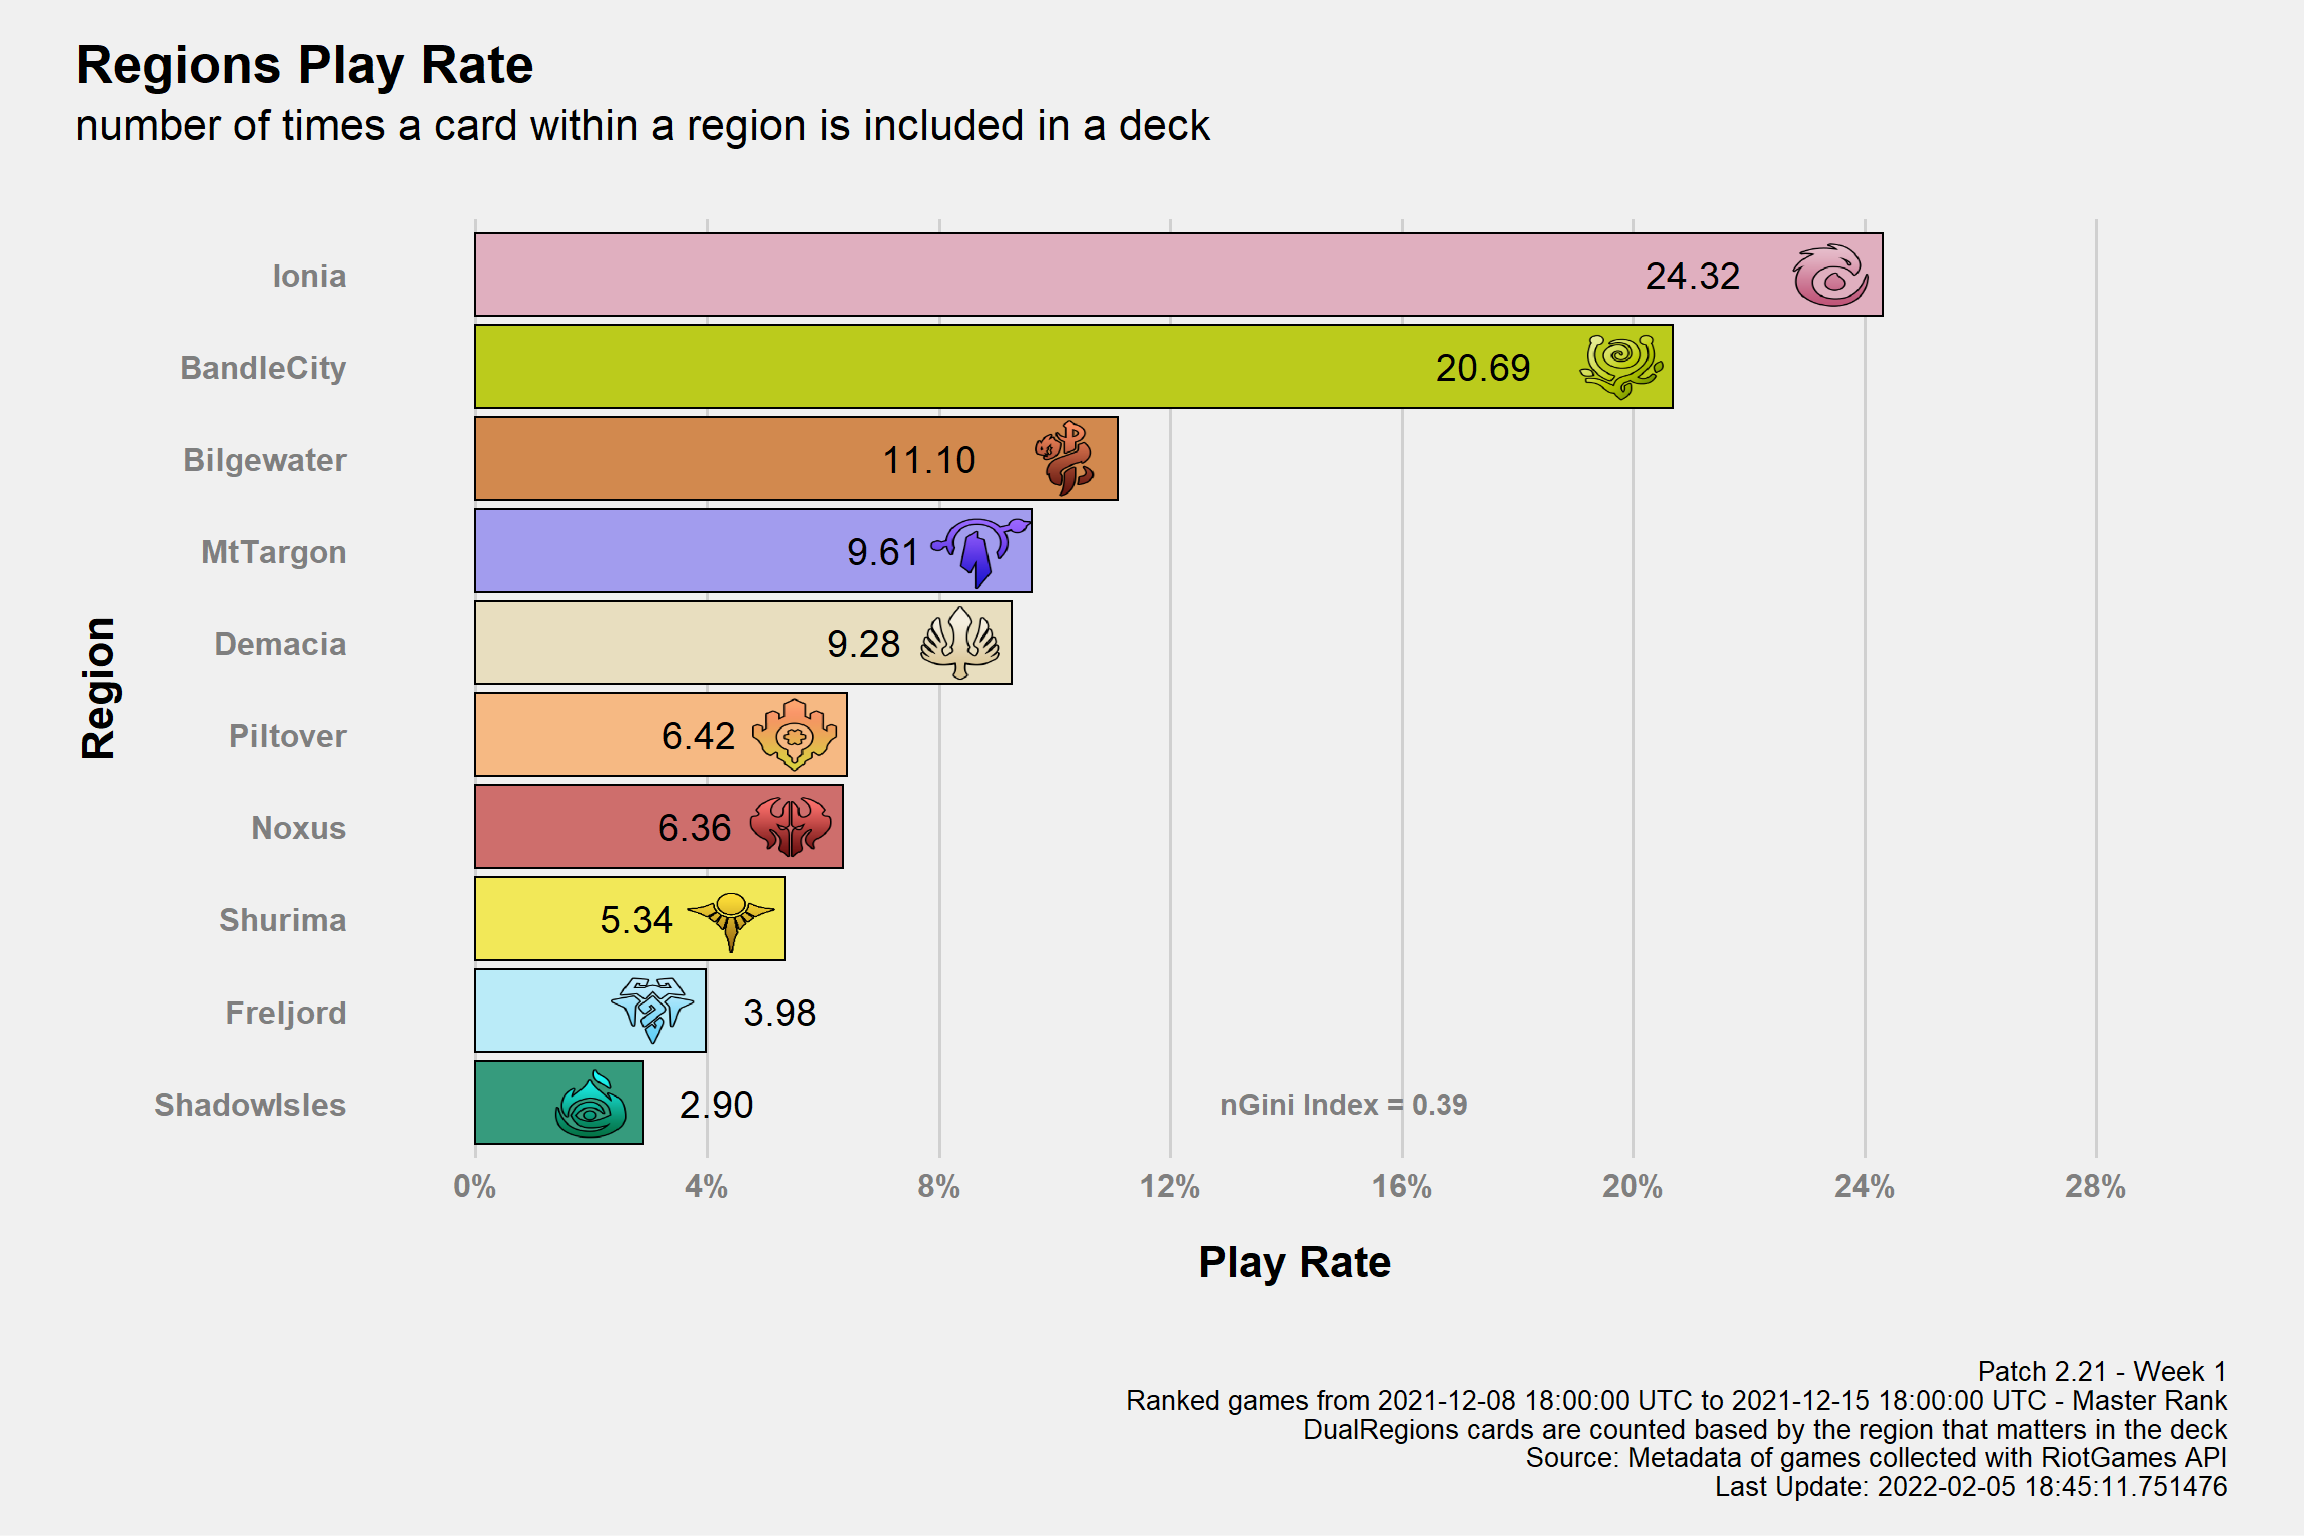
Play Rate by number of Cards
| Region Play Rate | ||||
|---|---|---|---|---|
| Relative Frequencies by number of times a Card within a Region is included in a Deck | ||||
| Region | Freq | Shard | ||
| America | Apac | Europe | ||
| Ionia | 24.32% | 22.02% | 32.80% | 25.56% |
| BandleCity | 20.69% | 19.98% | 26.86% | 19.37% |
| Bilgewater | 11.10% | 11.51% | 7.29% | 11.99% |
| MtTargon | 9.61% | 9.81% | 6.47% | 10.68% |
| Demacia | 9.28% | 10.29% | 7.87% | 7.61% |
| Piltover | 6.42% | 6.64% | 6.03% | 6.12% |
| Noxus | 6.36% | 6.41% | 4.07% | 7.33% |
| Shurima | 5.34% | 5.52% | 4.97% | 5.12% |
| Freljord | 3.98% | 4.46% | 2.31% | 3.66% |
| ShadowIsles | 2.90% | 3.36% | 1.33% | 2.56% |
| Patch 2.21 - Week 1 Ranked games from 2021-12-08 18:00:00 UTC to 2021-12-15 18:00:00 UTC Source: Metadata of games collected with RiotGames API Last Update: 2022-02-05 18:41:16.217354 | ||||
Champions Combinations
Play Rates
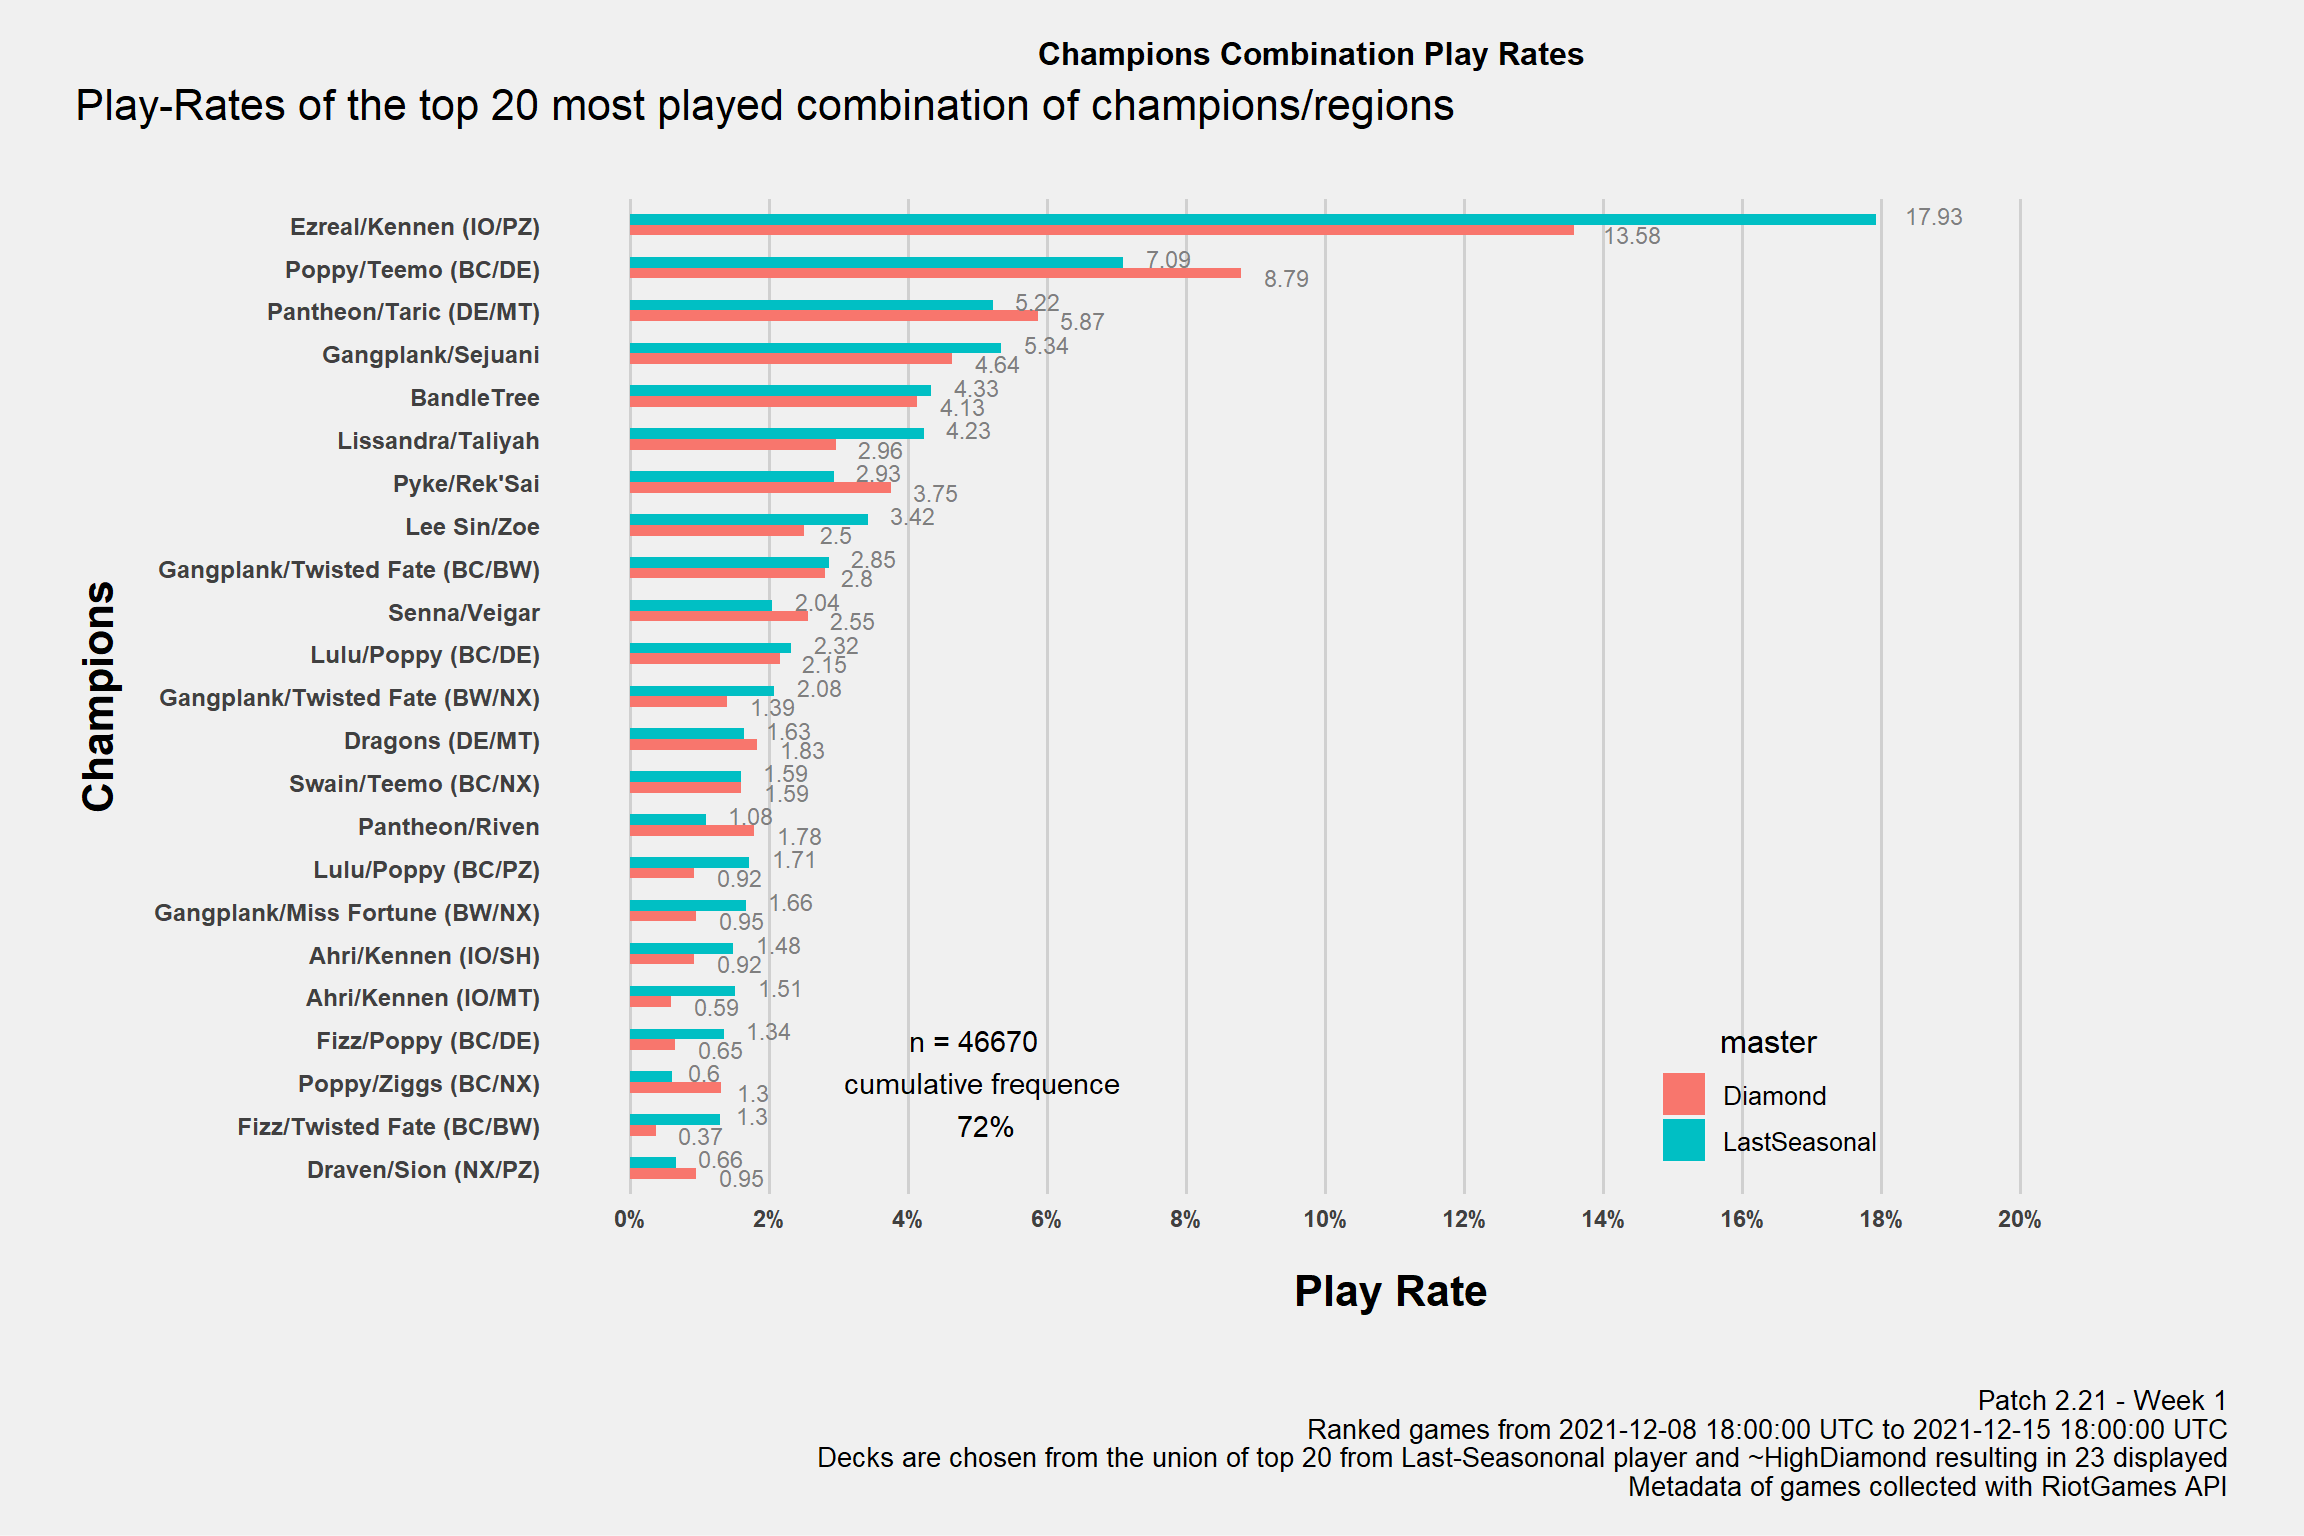
Data from Last-Season Master Only. Source: Source: Metadata of games collected with RiotGames API FALSE
Data from Current Master Only. Source: Source: Metadata of games collected with RiotGames API FALSE
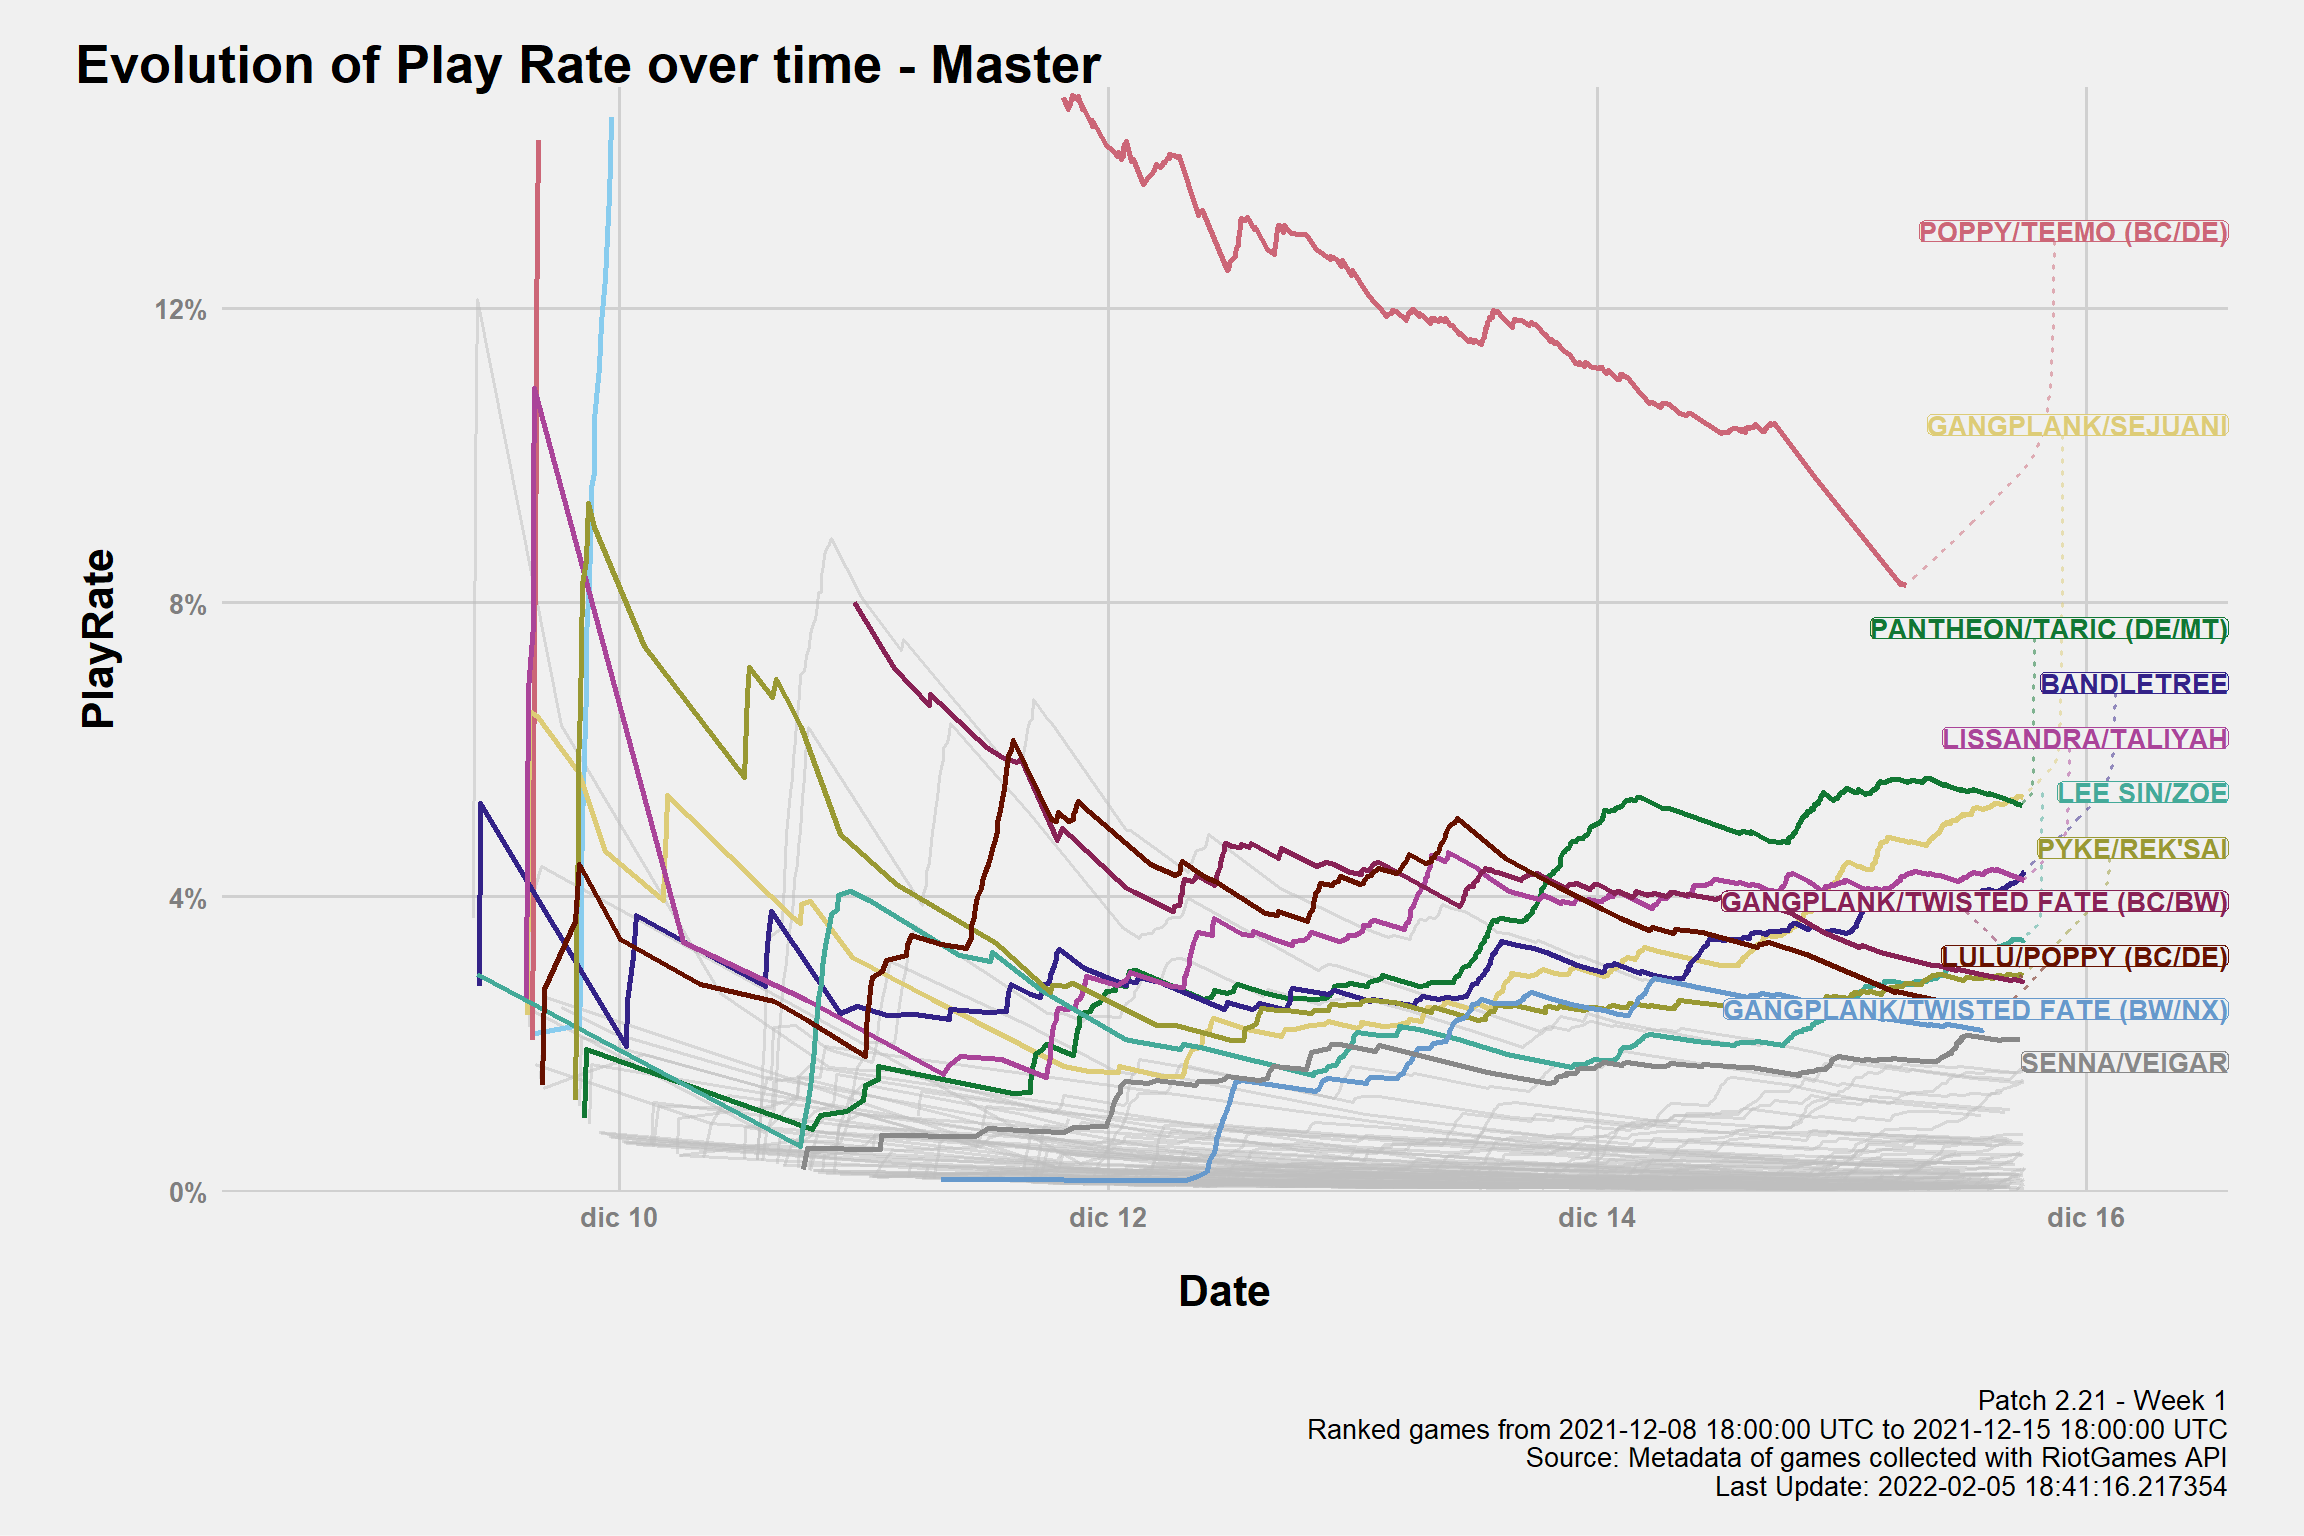
Day by Day
Highlisting the top10 most played decks (at the moment of the last game played).
Win Rates
Tie games are excluded
Win rates of the most played combination of champions. Play Rate >= 1% in at least one of the servers.
Top Win rates of the top10 best performing least played combination of champions. Play rate ∈ [0.1%,1%)
Match Ups
Note:: only games from Last-Season Master
Regarding MU, this is not the most accurate estimation you can get from my data. If you want a better picture of the current meta it would be better to look at the dedicated MU-page where I use all “Ranked” games with the current sets of buffs and nerfs. While one may object I don’t account for optimizations and differences in skills acquired during the weeks, the overall number of games / sample size makes them a better source of information. So, in case, please refer to the MU - page for a better “meta-investigation”.
The win rates on the grid are among the 10 most played champion combination. The upper value is from all the Last-Season Masters, the bottom one only from the current Current Masters. MU with less than 30 games are not included.
| Ezreal/Kennen (IO/PZ) | Poppy/Teemo (BC/DE) | Gangplank/Sejuani | Pantheon/Taric (DE/MT) | BandleTree | Lissandra/Taliyah | Lee Sin/Zoe | Pyke/Rek'Sai | Gangplank/Twisted Fate (BC/BW) | Lulu/Poppy (BC/DE) | |
|---|---|---|---|---|---|---|---|---|---|---|
| Ezreal/Kennen (IO/PZ) | NA
|
51.2%
47.2% |
47.2%
55.0% |
64.4%
67.1% |
57.4%
55.1% |
48.9%
34.8% |
47.1%
70.7% |
53.6%
61.2% |
48.8%
41.6% |
62.1%
53.5% |
| Poppy/Teemo (BC/DE) | 48.8%
52.8% |
NA
|
43.8%
47.2% |
41.7%
40.6% |
69.2%
62.2% |
64.7%
66.1% |
22.2%
44.8% |
33.3%
41.1% |
58.8%
63.9% |
58.3%
56.3% |
| Gangplank/Sejuani | 52.8%
45.0% |
56.2%
52.8% |
NA
|
45.5%
51.0% |
70.6%
57.0% |
40.0%
39.2% |
27.8%
35.1% |
45.5%
53.2% |
33.3%
61.2% |
0.0%
41.5% |
| Pantheon/Taric (DE/MT) | 35.6%
32.9% |
58.3%
59.4% |
54.5%
49.0% |
NA
|
45.5%
58.3% |
70.0%
53.4% |
7.7%
28.2% |
50.0%
50.0% |
100.0%
73.2% |
80.0%
55.3% |
| BandleTree | 42.6%
44.9% |
30.8%
37.8% |
29.4%
43.0% |
54.5%
41.7% |
NA
|
27.8%
42.0% |
66.7%
68.3% |
50.0%
57.1% |
66.7%
44.9% |
11.1%
37.2% |
| Lissandra/Taliyah | 51.1%
65.2% |
35.3%
33.9% |
60.0%
60.8% |
30.0%
46.6% |
72.2%
58.0% |
NA
|
50.0%
54.5% |
27.3%
34.9% |
50.0%
62.5% |
16.7%
|
| Lee Sin/Zoe | 52.9%
29.3% |
77.8%
55.2% |
72.2%
64.9% |
92.3%
71.8% |
33.3%
31.7% |
50.0%
45.5% |
NA
|
50.0%
57.1% |
40.0%
76.5% |
83.3%
|
| Pyke/Rek'Sai | 46.4%
38.8% |
66.7%
58.9% |
54.5%
46.8% |
50.0%
50.0% |
50.0%
42.9% |
72.7%
65.1% |
50.0%
42.9% |
NA
|
25.0%
40.5% |
71.4%
46.7% |
| Gangplank/Twisted Fate (BC/BW) | 51.2%
58.4% |
41.2%
36.1% |
66.7%
38.8% |
0.0%
26.8% |
33.3%
55.1% |
50.0%
37.5% |
60.0%
23.5% |
75.0%
59.5% |
NA
|
0.0%
|
| Lulu/Poppy (BC/DE) | 37.9%
46.5% |
41.7%
43.7% |
100.0%
58.5% |
20.0%
44.7% |
88.9%
62.8% |
83.3%
|
16.7%
|
28.6%
53.3% |
100.0%
|
NA
|
| The upper value is from Last-Seasononal Players while the bottom value is from ~HighDiamond. MU with less than 30 games are not included. Order of the Archetypes based on the playrate over the last 7 days from the last-update from the upper value population. Source: Metadata of games collected with RiotGames API | ||||||||||
Deck of the week
I actually wanted to feature something else but, after recent events maybe the deck even needs “some help”
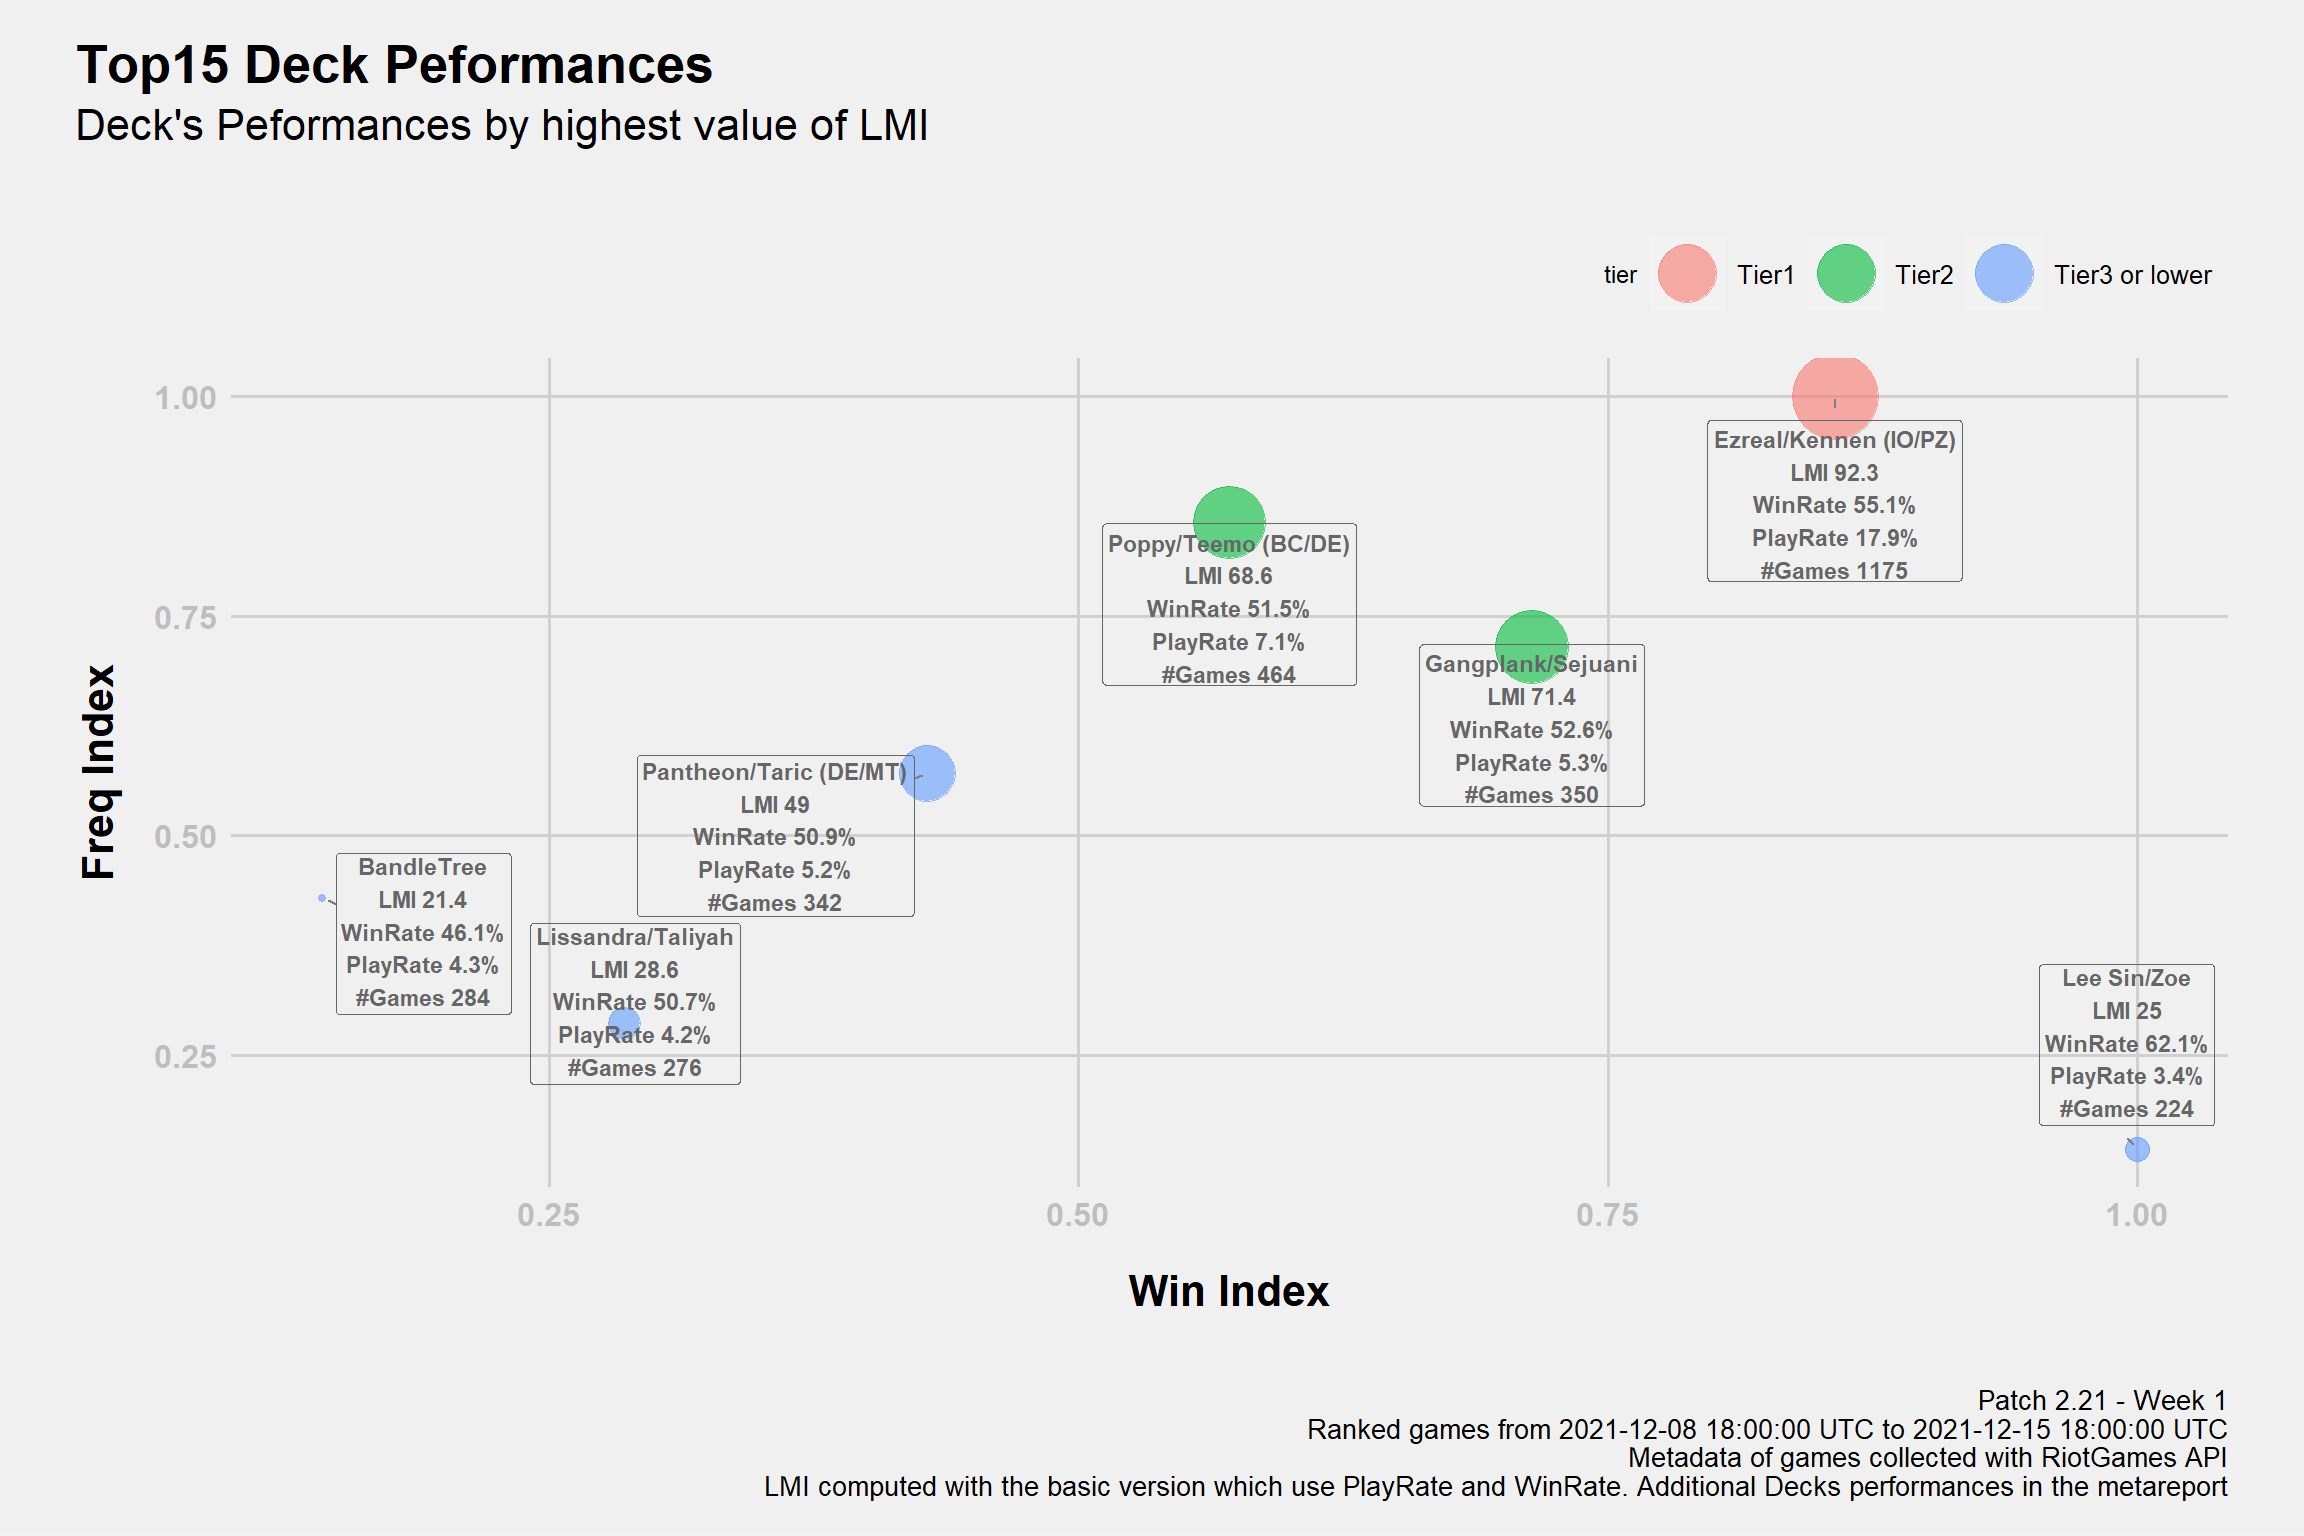
LoR-Meta Index (LMI)
Tier0 with LMI >= 97.5
Tier1 with LMI ∈ [85,97.5)
Tier2 with LMI ∈ [60,85)
Tier3 or lower with LMI < 60
The LMI
2 is an Index I developed to measure the performance of decks in the metagame. For those who are familiar with basic statistical concept I wrote a document to explain the theory behind it: , it’s very similar to vicioussyndicate (vS) Meta Score from their data reaper report. The score of each deck is not just their “strength”, it takes in consideration both play rates and win rates that’s why I prefer to say it measure the “performance”. The values range from 0 to 100 and the higher the value, the higher is the performance. 3
Win Marathons Leaders
Top3 Players (or more in case of ties) from each server that had the highest amount of consecutive wins with the same archetype. The provided deckcode is the one played in the last win found.
| Top3 Biggest Win Streak by Server | |||
|---|---|---|---|
| Cumulative wins with the same Archetype | |||
| Player | Result | Archetype | Deck Code |
| Americas | |||
| mtucks | 12 | Ezreal/Kennen (IO/PZ) | |
| Zorig Dungu | 12 | Ezreal/Kennen (IO/PZ) | |
| Venndulum | 9 | Ezreal/Kennen (IO/PZ) | |
| XxWhatAmIxX | 9 | Lee Sin/Zoe | |
| Apac | |||
| pisukaru | 11 | Sejuani/Teemo (BC/FR) | |
| Deye | 8 | Lulu/Poppy (BC/PZ) | |
| Sword of Akasha | 8 | Ahri/Kennen (IO/SH) | |
| Europe | |||
| 斗鱼9382777 | 11 | Gangplank/Twisted Fate (BC/BW) | |
| Broken Ball | 10 | Lee Sin/Zoe | |
| ragnarosich | 10 | Lissandra/Taliyah | |
| Games from all Master are collected each hour adding up to the last 20 matches. Unlikely but possible to miss games in case of high frequency games. Metadata of games collected with RiotGames API | |||
Cards Presence
It seems that not even Twin Disciple can beat Sharsight
Cards that couldn’t find place even in a meme deck.
Not-Standard Archetype Names
Names and rules for the “non standard archetypes” which are not defined by Champion+Regions
| Archetype ~Fix | |
|---|---|
| Deck | Source |
| ASZ - Sivir Ionia | Akshan/Sivir (IO/SH) or Sivir/Zed or Akshan/Sivir/Zed |
| RubinBait - <Champ> | Burn Deck using <Champ> to bait mulligan |
| Dragons (DE/MT) | (DE/MT) Decks with *at least* Shyvana and ASol |
| SunDisc | Mono Shurima with 1+ Sun Disc |
| Viktor - Shellfolk | Viktor + at least one of Curious Shellfolk/Mirror Mage + at least 2 Trinket Trade |
| Sentinel Control | PnZ/SI deck with a combination of Elise/Jayce/Vi |
Credits
Special thanks to bA1ance and Pavelicii for the recent support ^^
I may not express gratitude often but that’s because I think the best way I can do it is to continuing working hard on what I do and strive for improvements. Still, proper credits are necessary and I’ll try do it to them more often.
Legal bla bla
This content was created under Riot Games ‘Legal Jibber Jabber’ policy using assets owned by Riot Games. Riot Games does not endorse or sponsor this project.
