Data
Number of (Ranked) matches analysed 42325 or 84650 games. / Master
Number of (Ranked) matches analysed 105200 or 210400 games. / ~Plat+
Last Update: 2021-11-24 18:46
| Patch 2.19 - Week 2 - by the Numbers1 | ||||
|---|---|---|---|---|
| Characteristic3 | Current Master2 | Last-Season Master2 | ||
| N = 85,6504 | N = 42,3254 | N = 216,9324 | N = 105,2004 | |
| Status | ||||
| Ranked | 42,325 (49%) | 105,200 (48%) | ||
| Other | 41,071 (48%) | 108,434 (50%) | ||
| Friendly | 2,254 (2.6%) | 3,298 (1.5%) | ||
| Server | ||||
| americas | 35,410 (41%) | 16,696 (39%) | 97,169 (45%) | 45,638 (43%) |
| asia | 18,635 (22%) | 8,188 (19%) | 38,072 (18%) | 16,613 (16%) |
| europe | 31,605 (37%) | 17,441 (41%) | 81,691 (38%) | 42,949 (41%) |
|
1
Max datetime recovered: 2021-11-24 17:07:19 UTC from 2021-11-17 18:00:00 to 2021-11-24 18:00:00 UTC
2
EU Master playerDecks in the ladder 512 while number of possible Master playerDecks recovered is 505, Number of Last-Season EU Master used 1509
NA Master playerDecks in the ladder 533 while number of possible Master playerDecks recovered is 532, Number of Last-Season NA Master used 1733
ASIA Master playerDecks in the ladder 227 while number of possible Master playerDecks recovered is 226, Number of Last-Season ASIA Master used 600
3
Metadata from Friendly Matches (that aren't Bo3) is not recoverable,
the value may not be perfect since I lack the starting time of the game. The amount of Games to still scrap is also an estimation based on the 'position' of the game
4
n(%) took from the number of matches. When the data is analysed the size is double since we account each different player
|
||||
Regions
Switching back to Master as this report is supposed to be
Play Rate
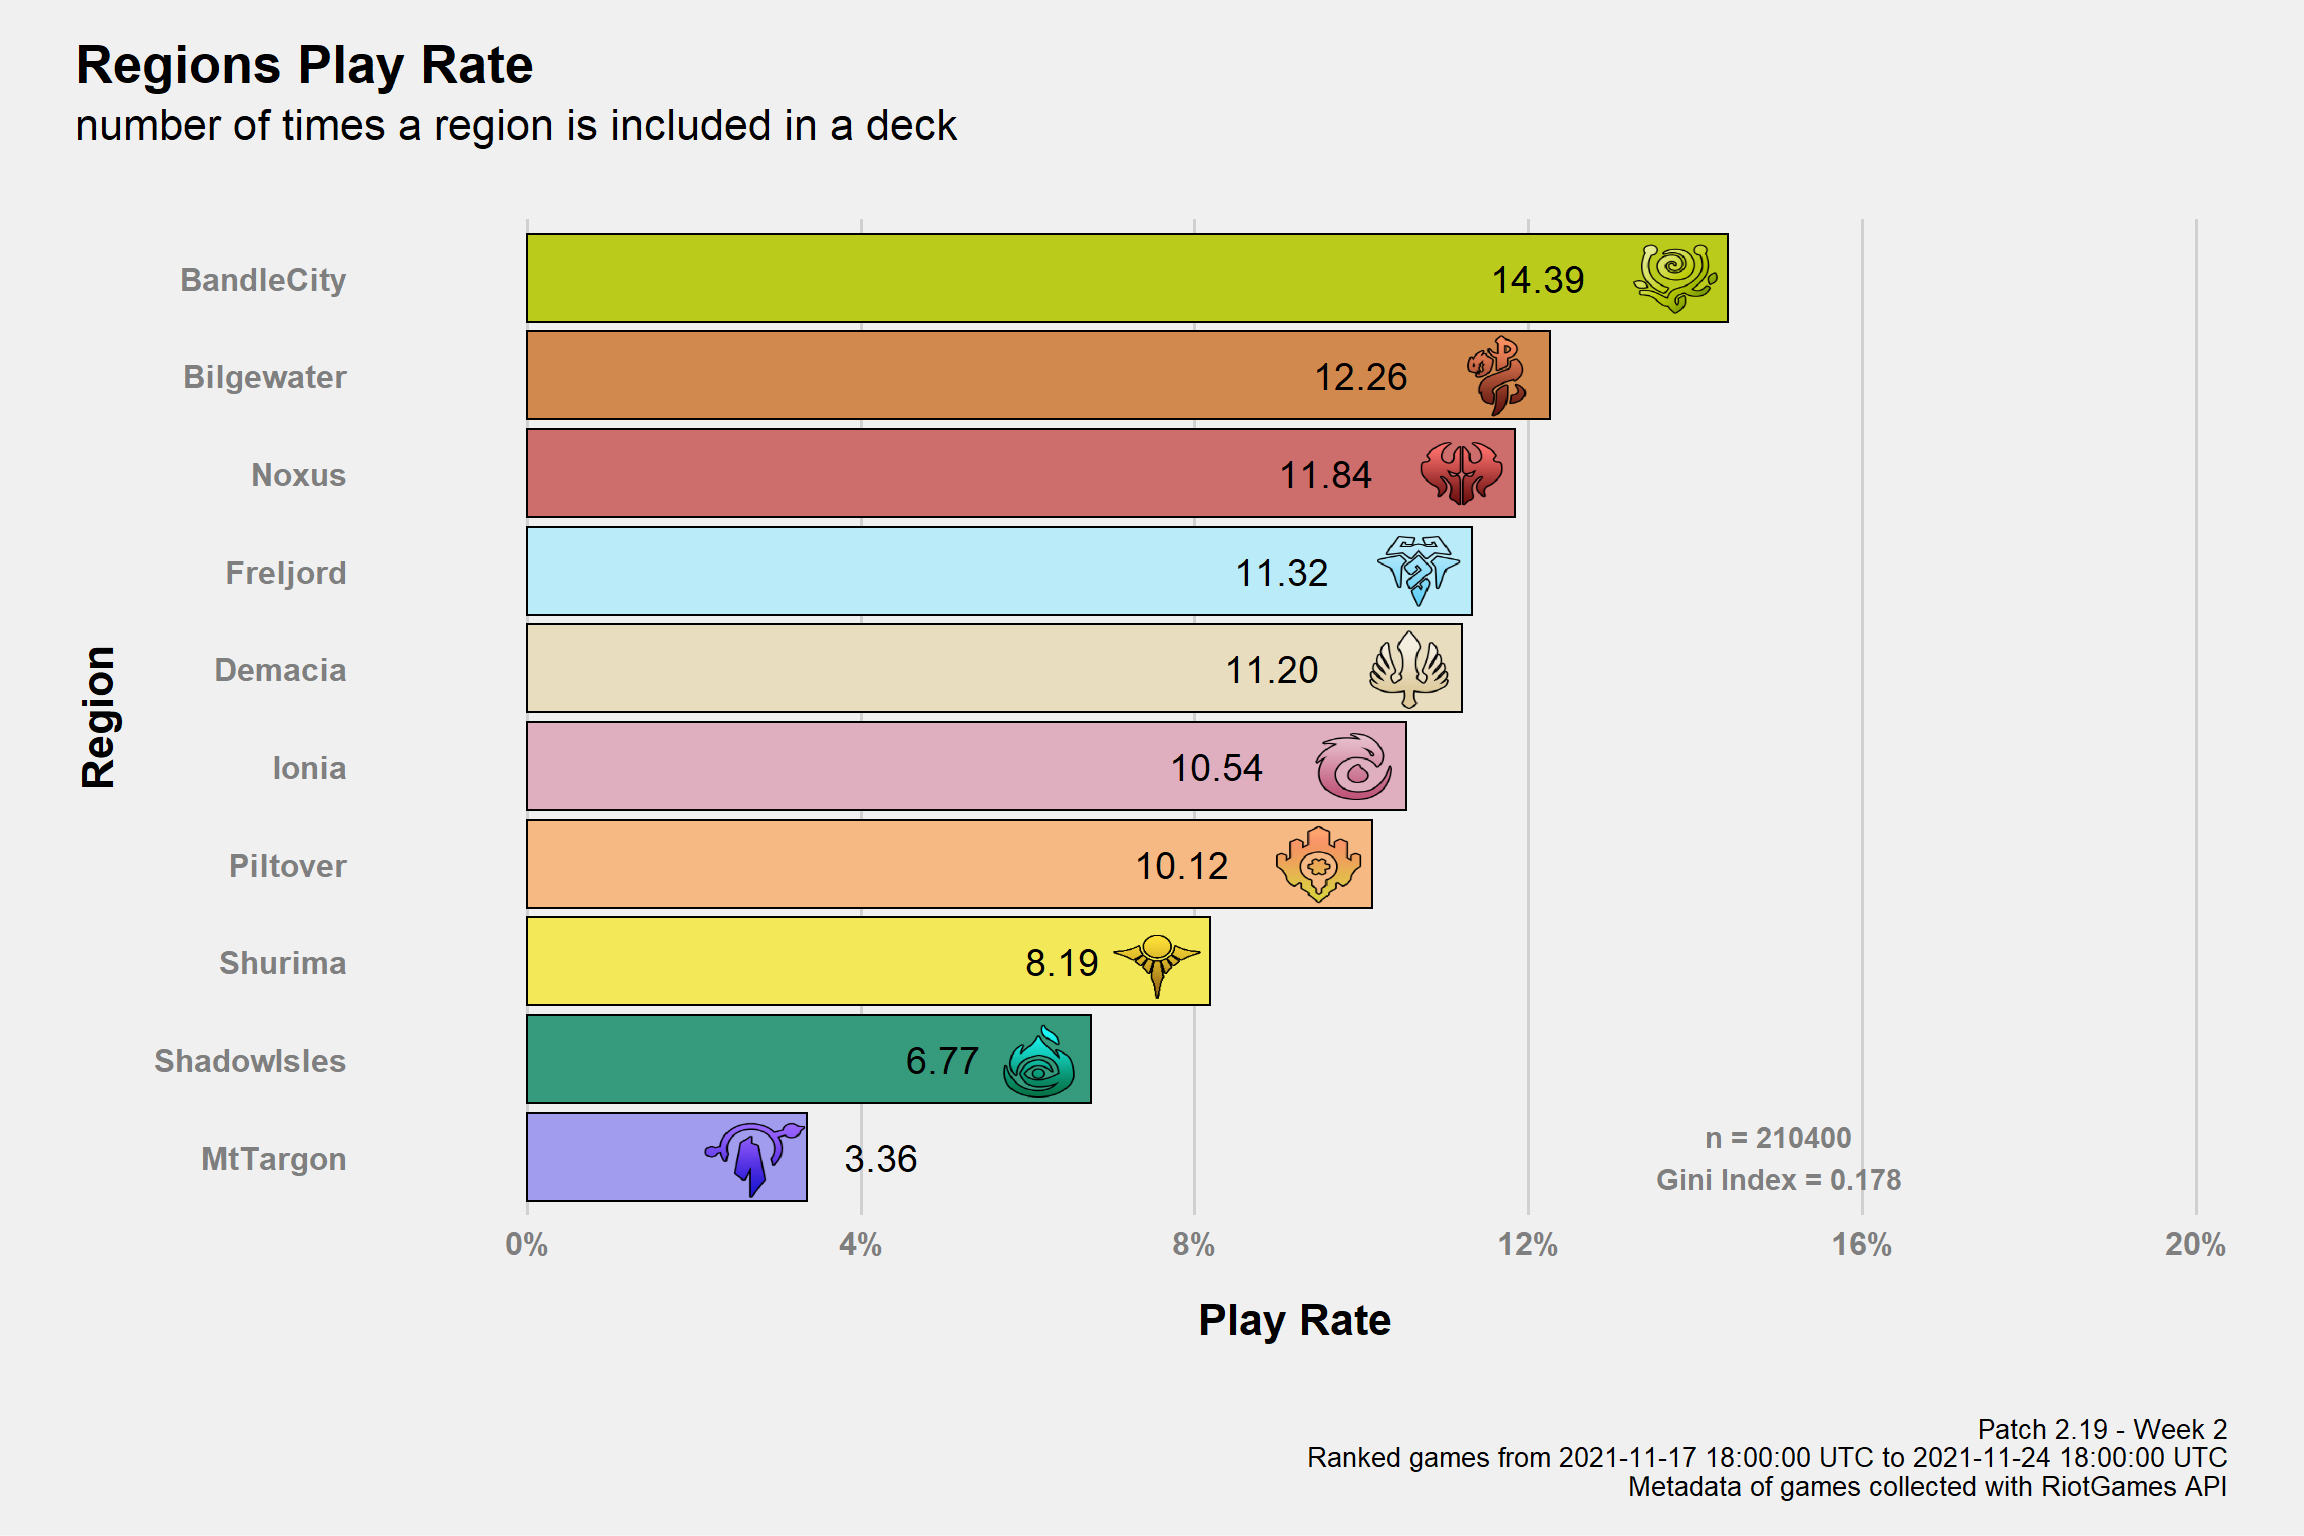
The Gini Index is a measure of heterogeneity so, in this case and in simpler terms, how much the play rates are similar. The Index goes (when normalized like here) in [0,1] and it’s equal to 1 when there’s a single value with 100% play rate or 0 when all play rates are equal. Of course a Gini Index of 1 needs to be avoided but it’s not like the aim should be 0. As said, it’s just to add some additional tools.
| Region Play Rate | ||||
|---|---|---|---|---|
| Relative Frequencies by Inclusion Rate of a Region | ||||
| Region | Freq | Shard | ||
| America | Asia | Europe | ||
| BandleCity | 14.39% | 13.31% | 16.71% | 14.33% |
| Bilgewater | 12.26% | 13.46% | 11.56% | 11.45% |
| Noxus | 11.84% | 10.26% | 12.53% | 13.02% |
| Freljord | 11.32% | 11.97% | 9.87% | 11.39% |
| Demacia | 11.20% | 11.04% | 10.98% | 11.46% |
| Ionia | 10.54% | 11.14% | 10.12% | 10.16% |
| Piltover | 10.12% | 10.59% | 9.95% | 9.76% |
| Shurima | 8.19% | 9.10% | 9.03% | 6.93% |
| ShadowIsles | 6.77% | 5.56% | 6.73% | 7.94% |
| MtTargon | 3.36% | 3.56% | 2.54% | 3.56% |
| Patch 2.19 - Week 2 Ranked games from 2021-11-17 18:00:00 UTC to 2021-11-24 18:00:00 UTC Metadata of games collected with RiotGames API | ||||
Play Rate by number of Cards
Note: currently all dual region cards have only their main region as possible value assigned. The same problem also apply to the card’s inclusion rates.
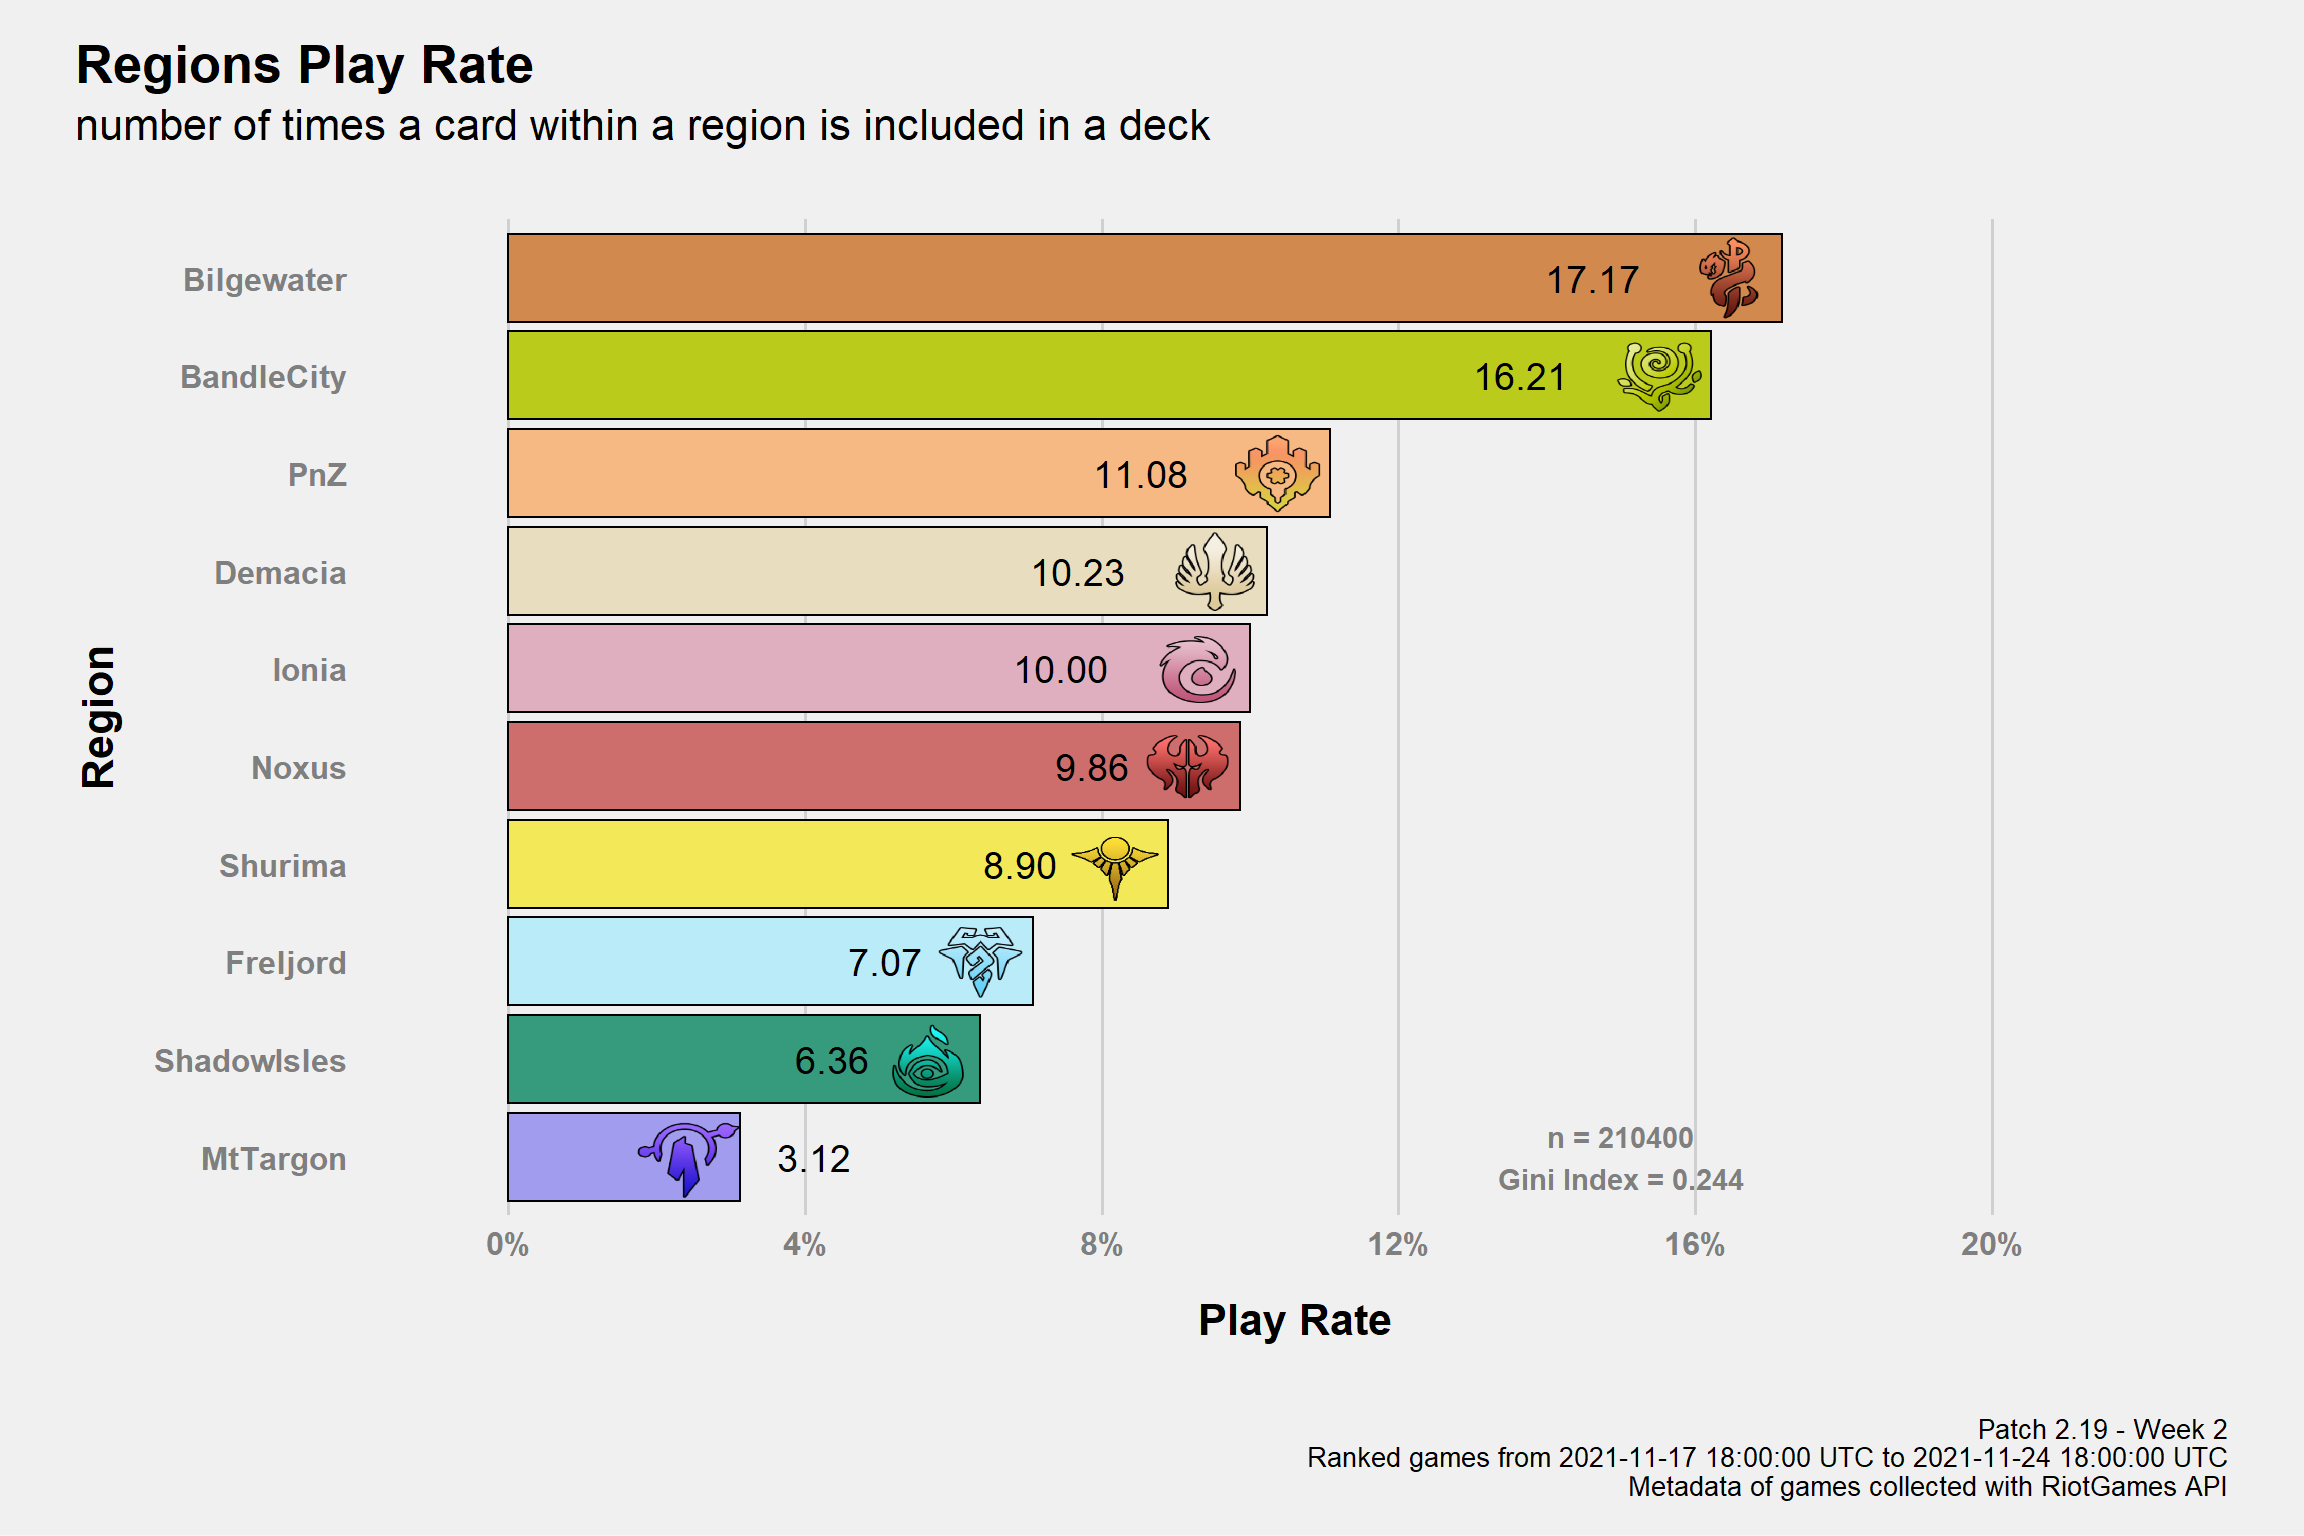
| Region Play Rate | ||||
|---|---|---|---|---|
| Relative Frequencies by number of times a Card within a Region is included in a Deck | ||||
| Region | Freq | Shard | ||
| America | Asia | Europe | ||
| Bilgewater | 17.17% | 18.26% | 15.81% | 16.76% |
| BandleCity | 16.21% | 14.47% | 19.26% | 16.45% |
| PnZ | 11.08% | 12.02% | 9.88% | 10.75% |
| Demacia | 10.23% | 9.93% | 10.29% | 10.48% |
| Ionia | 10.00% | 10.47% | 9.59% | 9.73% |
| Noxus | 9.86% | 8.79% | 9.80% | 10.90% |
| Shurima | 8.90% | 9.88% | 10.01% | 7.45% |
| Freljord | 7.07% | 7.51% | 6.96% | 6.69% |
| ShadowIsles | 6.36% | 5.29% | 6.26% | 7.44% |
| MtTargon | 3.12% | 3.37% | 2.14% | 3.35% |
| Patch 2.19 - Week 2 Ranked games from 2021-11-17 18:00:00 UTC to 2021-11-24 18:00:00 UTC Metadata of games collected with RiotGames API | ||||
Champions Combinations
Note: I know I have to add some aggregations especially for Bandle (sorry Dr.LoR)
| Archetype ~Fix | |
|---|---|
| Deck | Source |
| ASZ - Sivir Ionia | Akshan/Sivir (IO/SH) or Sivir/Zed or Akshan/Sivir/Zed |
| RubinBait - <Champ> | Burn Deck using <Champ> to bait mulligan |
| Dragons (DE/MT) | (DE/MT) Decks with *at least* Shyvana and ASol |
| SunDisc | Mono Shurima with 1+ Sun Disc |
Play Rates
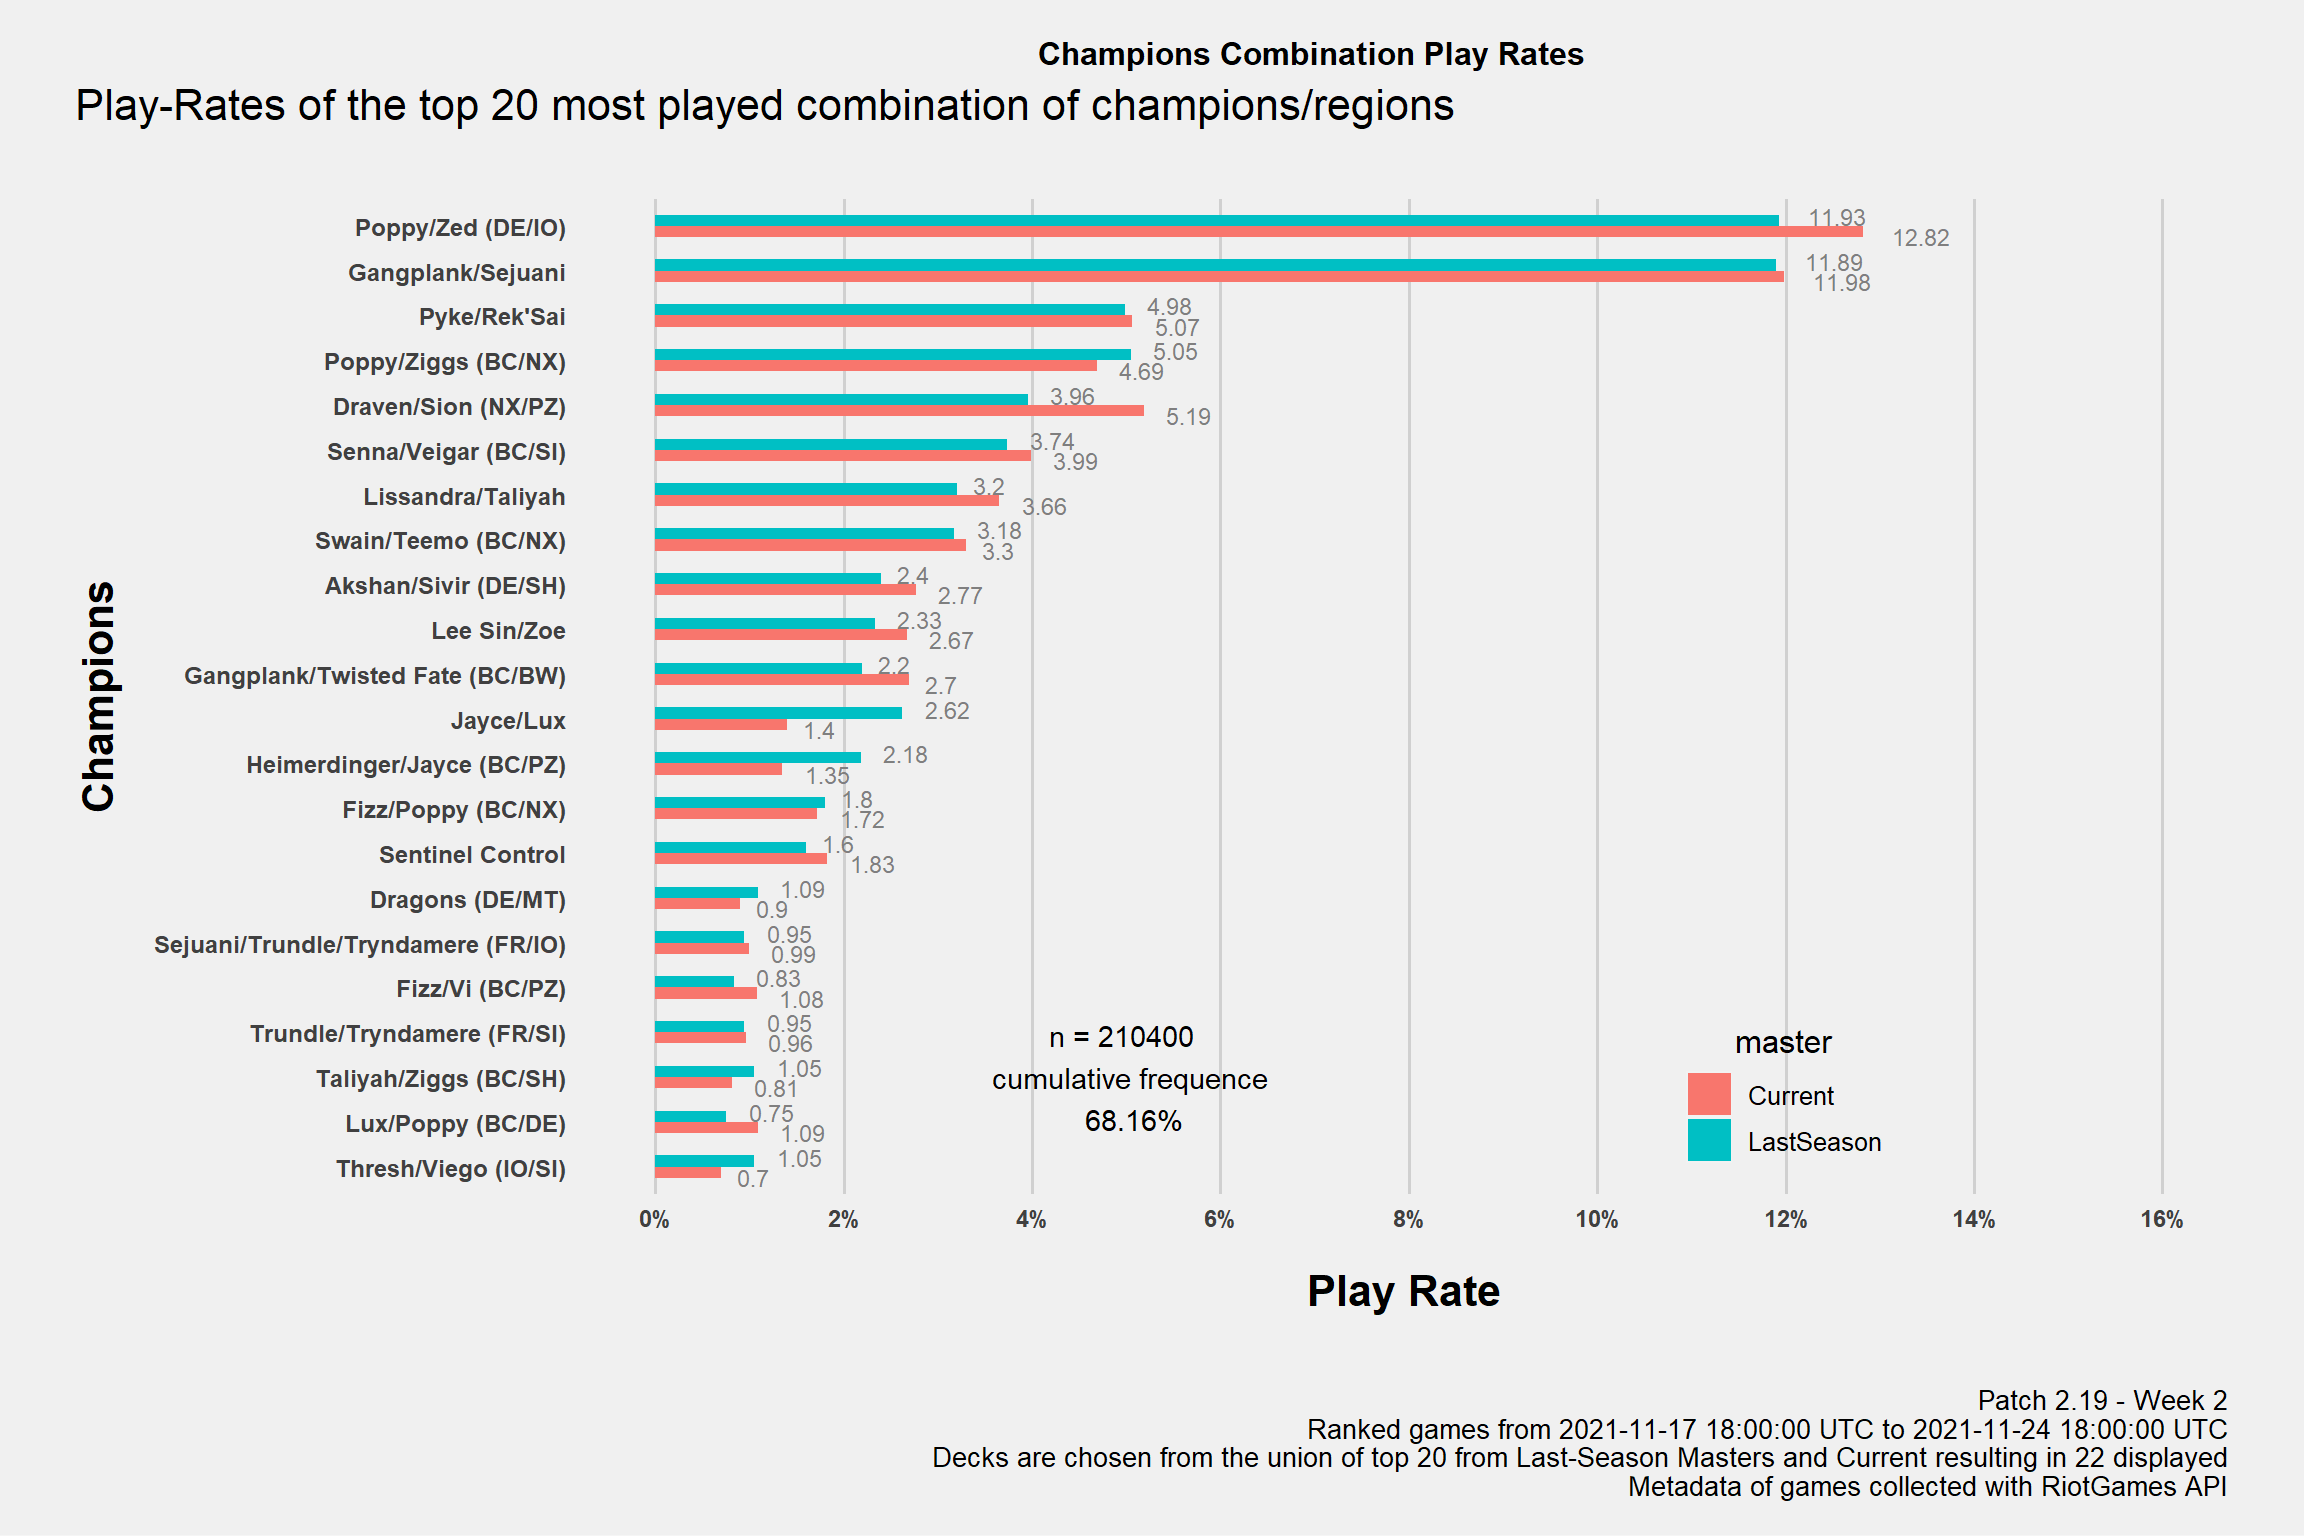
Data from Last-Season Master Only. Source: Source: Metadata of games collected with RiotGames API FALSE
Data from Current Master Only. Source: Source: Metadata of games collected with RiotGames API FALSE
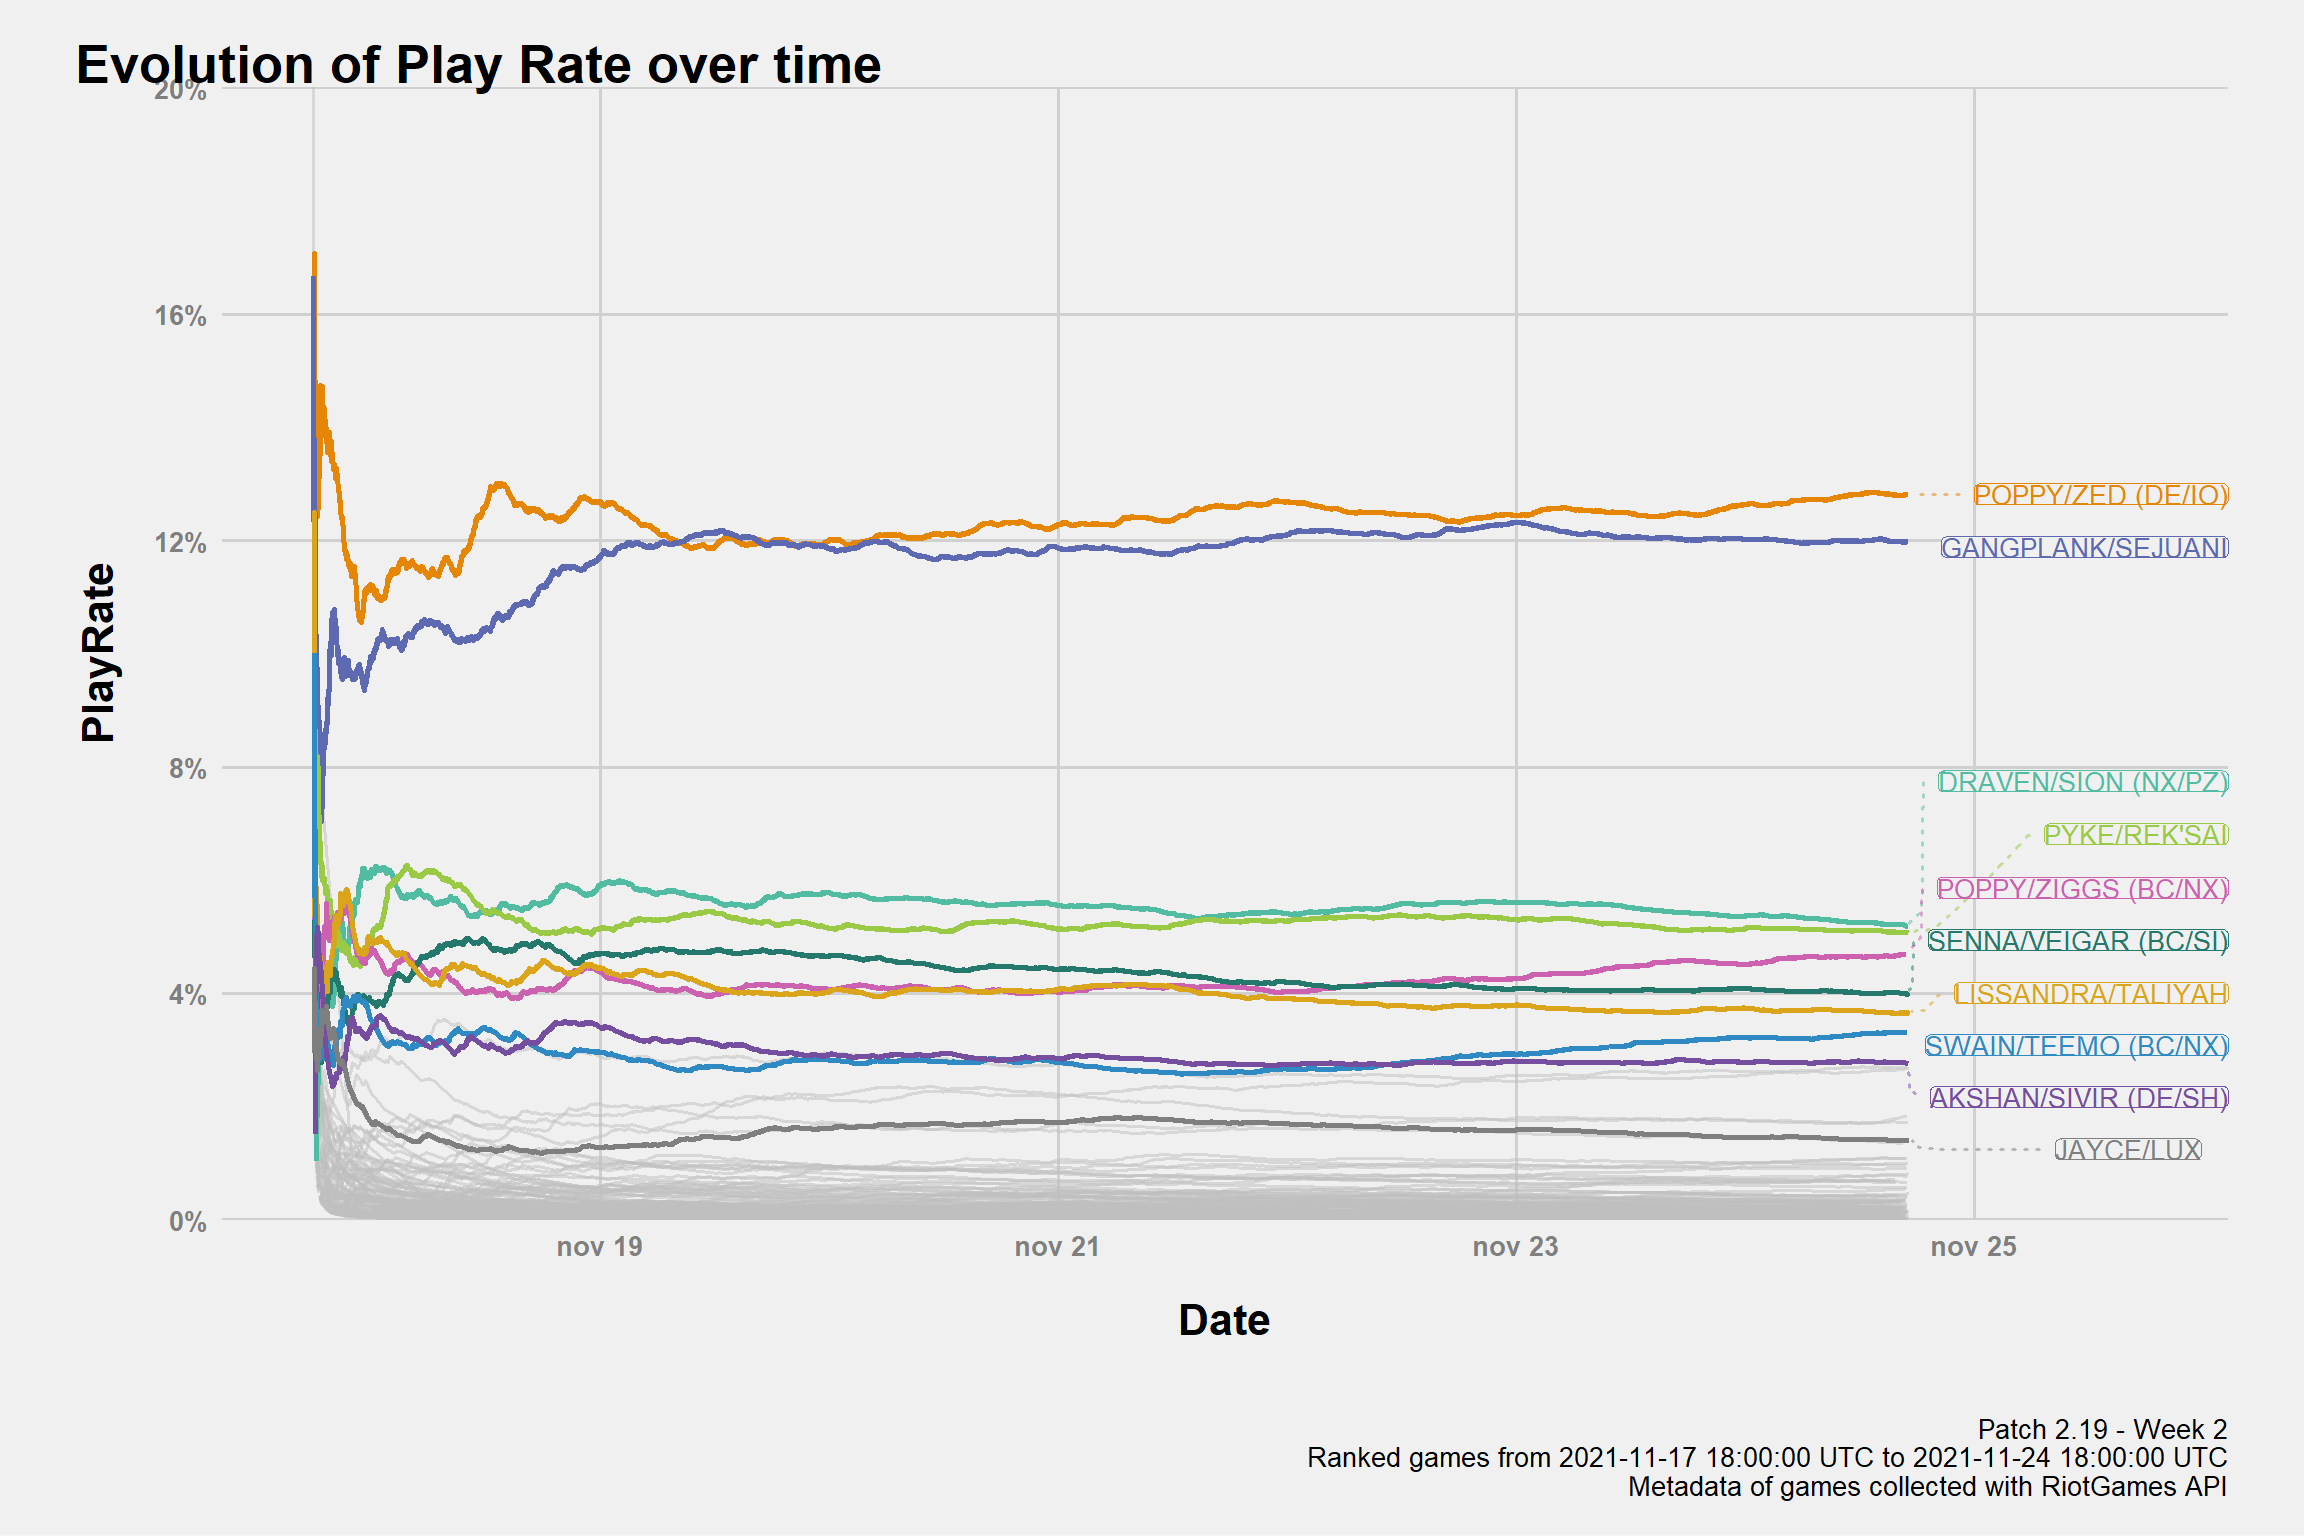
Day by Day
Highlisting the top10 most played decks (at the moment of the last game played).
Win Rates
Tie games are excluded / only games from ‘Old’ Master
Win rates of the most played combination of champions. Play Rate >= 1% in at least one of the servers.
Top Win rates of the top10 best performing least played combination of champions. Play rate ∈ [0.1%,1%)
Match Ups
Note:: only games from Last-Season Master
Regarding MU, this is not the most accurate estimation you can get from my data. If you want a better picture of the current meta it would be better to look at the dedicated MU-page where I use all “Ranked” games with the current sets of buffs and nerfs. While one may object I don’t account for optimizations and differences in skills acquired during the weeks, the overall number of games / sample size makes them a better source of information. So, in case, please refer to the MU - page for a better “meta-investigation”.
The win rates on the grid are among the 15 most played champion combination. The upper value is from all the Last-Season Masters, the bottom one only from the current Current Masters. MU with less than 30 games are not included.
| Poppy/Zed (DE/IO) | Gangplank/Sejuani | Poppy/Ziggs (BC/NX) | Pyke/Rek'Sai | Draven/Sion (NX/PZ) | Senna/Veigar (BC/SI) | Lissandra/Taliyah | Swain/Teemo (BC/NX) | Jayce/Lux | Akshan/Sivir (DE/SH) | Lee Sin/Zoe | Gangplank/Twisted Fate (BC/BW) | Heimerdinger/Jayce (BC/PZ) | Fizz/Poppy (BC/NX) | Sentinel Control | |
|---|---|---|---|---|---|---|---|---|---|---|---|---|---|---|---|
| Poppy/Zed (DE/IO) | NA
(NA) |
57.2%
(55.9%) |
46.3%
(47.9%) |
63.0%
(65.4%) |
49.1%
(49.6%) |
67.0%
(67.7%) |
71.6%
(72.2%) |
43.4%
(43.6%) |
51.2%
(50.4%) |
52.5%
(50.3%) |
66.5%
(66.9%) |
43.4%
(43.5%) |
55.3%
(53.4%) |
53.5%
(51.5%) |
41.9%
(41.8%) |
| Gangplank/Sejuani | 42.8%
(44.1%) |
NA
(NA) |
50.0%
(49.1%) |
54.6%
(51.3%) |
55.5%
(58.1%) |
55.2%
(52.3%) |
40.6%
(41.0%) |
64.8%
(67.4%) |
58.5%
(63.4%) |
58.7%
(62.4%) |
43.5%
(45.4%) |
52.0%
(50.5%) |
60.2%
(63.3%) |
48.4%
(53.2%) |
52.0%
(52.8%) |
| Poppy/Ziggs (BC/NX) | 53.7%
(52.1%) |
50.0%
(50.9%) |
NA
(NA) |
60.4%
(59.6%) |
40.4%
(37.3%) |
44.9%
(46.6%) |
68.1%
(60.8%) |
63.2%
(66.7%) |
62.9%
(68.6%) |
48.8%
(51.4%) |
33.9%
(29.1%) |
39.1%
(37.9%) |
62.6%
(57.8%) |
46.2%
(48.6%) |
32.8%
(31.6%) |
| Pyke/Rek'Sai | 37.0%
(34.6%) |
45.4%
(48.7%) |
39.6%
(40.4%) |
NA
(NA) |
36.7%
(36.7%) |
52.9%
(48.0%) |
57.8%
(59.8%) |
54.0%
(53.1%) |
55.9%
(67.7%) |
43.5%
(42.7%) |
52.0%
(53.2%) |
41.2%
(43.3%) |
46.5%
(54.7%) |
42.6%
(45.2%) |
52.8%
(55.4%) |
| Draven/Sion (NX/PZ) | 50.9%
(50.4%) |
44.5%
(41.9%) |
59.6%
(62.7%) |
63.3%
(63.3%) |
NA
(NA) |
42.0%
(43.2%) |
39.6%
(37.8%) |
45.0%
(47.0%) |
60.5%
(54.8%) |
65.2%
(61.8%) |
30.5%
(31.4%) |
41.5%
(41.0%) |
44.0%
(41.4%) |
66.9%
(58.5%) |
58.0%
(54.3%) |
| Senna/Veigar (BC/SI) | 33.0%
(32.3%) |
44.8%
(47.7%) |
55.1%
(53.4%) |
47.1%
(52.0%) |
58.0%
(56.8%) |
NA
(NA) |
42.5%
(43.3%) |
54.0%
(48.6%) |
48.3%
(48.1%) |
39.5%
(37.9%) |
69.9%
(67.3%) |
66.1%
(64.6%) |
59.5%
(69.4%) |
30.4%
(30.9%) |
52.8%
(53.1%) |
| Lissandra/Taliyah | 28.4%
(27.8%) |
59.4%
(59.0%) |
31.9%
(39.2%) |
42.2%
(40.2%) |
60.4%
(62.2%) |
57.5%
(56.7%) |
NA
(NA) |
50.0%
(43.1%) |
42.0%
(48.2%) |
44.8%
(44.9%) |
49.4%
(51.4%) |
55.0%
(50.7%) |
67.6%
(69.0%) |
47.5%
(57.1%) |
62.3%
(68.2%) |
| Swain/Teemo (BC/NX) | 56.6%
(56.4%) |
35.2%
(32.6%) |
36.8%
(33.3%) |
46.0%
(46.9%) |
55.0%
(53.0%) |
46.0%
(51.4%) |
50.0%
(56.9%) |
NA
(NA) |
43.5%
(38.7%) |
51.2%
(47.3%) |
69.0%
(64.4%) |
38.8%
(41.2%) |
43.4%
(45.0%) |
55.8%
(60.0%) |
36.5%
(40.0%) |
| Jayce/Lux | 48.8%
(49.6%) |
41.5%
(36.6%) |
37.1%
(31.4%) |
44.1%
(32.3%) |
39.5%
(45.2%) |
51.7%
(51.9%) |
58.0%
(51.8%) |
56.5%
(61.3%) |
NA
(NA) |
52.0%
(51.4%) |
36.1%
(NA) |
46.4%
(NA) |
65.1%
(NA) |
46.2%
(NA) |
65.6%
(NA) |
| Akshan/Sivir (DE/SH) | 47.5%
(49.7%) |
41.3%
(37.6%) |
51.2%
(48.6%) |
56.5%
(57.3%) |
34.8%
(38.2%) |
60.5%
(62.1%) |
55.2%
(55.1%) |
48.8%
(52.7%) |
48.0%
(48.6%) |
NA
(NA) |
55.6%
(44.4%) |
48.7%
(47.8%) |
49.5%
(60.0%) |
60.9%
(59.1%) |
63.7%
(60.0%) |
| Lee Sin/Zoe | 33.5%
(33.1%) |
56.5%
(54.6%) |
66.1%
(70.9%) |
48.0%
(46.8%) |
69.5%
(68.6%) |
30.1%
(32.7%) |
50.6%
(48.6%) |
31.0%
(35.6%) |
63.9%
(NA) |
44.4%
(55.6%) |
NA
(NA) |
57.9%
(60.7%) |
40.2%
(35.9%) |
37.2%
(31.1%) |
53.2%
(54.8%) |
| Gangplank/Twisted Fate (BC/BW) | 56.6%
(56.5%) |
48.0%
(49.5%) |
60.9%
(62.1%) |
58.8%
(56.7%) |
58.5%
(59.0%) |
33.9%
(35.4%) |
45.0%
(49.3%) |
61.2%
(58.8%) |
53.6%
(NA) |
51.3%
(52.2%) |
42.1%
(39.3%) |
NA
(NA) |
62.2%
(NA) |
69.5%
(80.6%) |
35.3%
(37.5%) |
| Heimerdinger/Jayce (BC/PZ) | 44.7%
(46.6%) |
39.8%
(36.7%) |
37.4%
(42.2%) |
53.5%
(45.3%) |
56.0%
(58.6%) |
40.5%
(30.6%) |
32.4%
(31.0%) |
56.6%
(55.0%) |
34.9%
(NA) |
50.5%
(40.0%) |
59.8%
(64.1%) |
37.8%
(NA) |
NA
(NA) |
48.8%
(NA) |
48.5%
(NA) |
| Fizz/Poppy (BC/NX) | 46.5%
(48.5%) |
51.6%
(46.8%) |
53.8%
(51.4%) |
57.4%
(54.8%) |
33.1%
(41.5%) |
69.6%
(69.1%) |
52.5%
(42.9%) |
44.2%
(40.0%) |
53.8%
(NA) |
39.1%
(40.9%) |
62.8%
(68.9%) |
30.5%
(19.4%) |
51.2%
(NA) |
NA
(NA) |
41.4%
(NA) |
| Sentinel Control | 58.1%
(58.2%) |
48.0%
(47.2%) |
67.2%
(68.4%) |
47.2%
(44.6%) |
42.0%
(45.7%) |
47.2%
(46.9%) |
37.7%
(31.8%) |
63.5%
(60.0%) |
34.4%
(NA) |
36.3%
(40.0%) |
46.8%
(45.2%) |
64.7%
(62.5%) |
51.5%
(NA) |
58.6%
(NA) |
NA
(NA) |
| The upper value is from Last-Season Masters while the bottom value is from New Masters. MU with less than 30 games are not included. Order of the Archetypes based on the playrate over the last 7 days from the last-update from Plat+ (change to Master once the ladder is more populated). Source: Metadata of games collected with RiotGames API | |||||||||||||||
Deck of the week
At Swain this season is finally the “cool Daddy” who helps everyone; for this week I opted for a deck that is barely played at Master but still played enough to appear in my stats, also it seems interesting.
It’s a differentiation of “Seena/Ez-Regreats”, with Swain package instead of Ezreal.
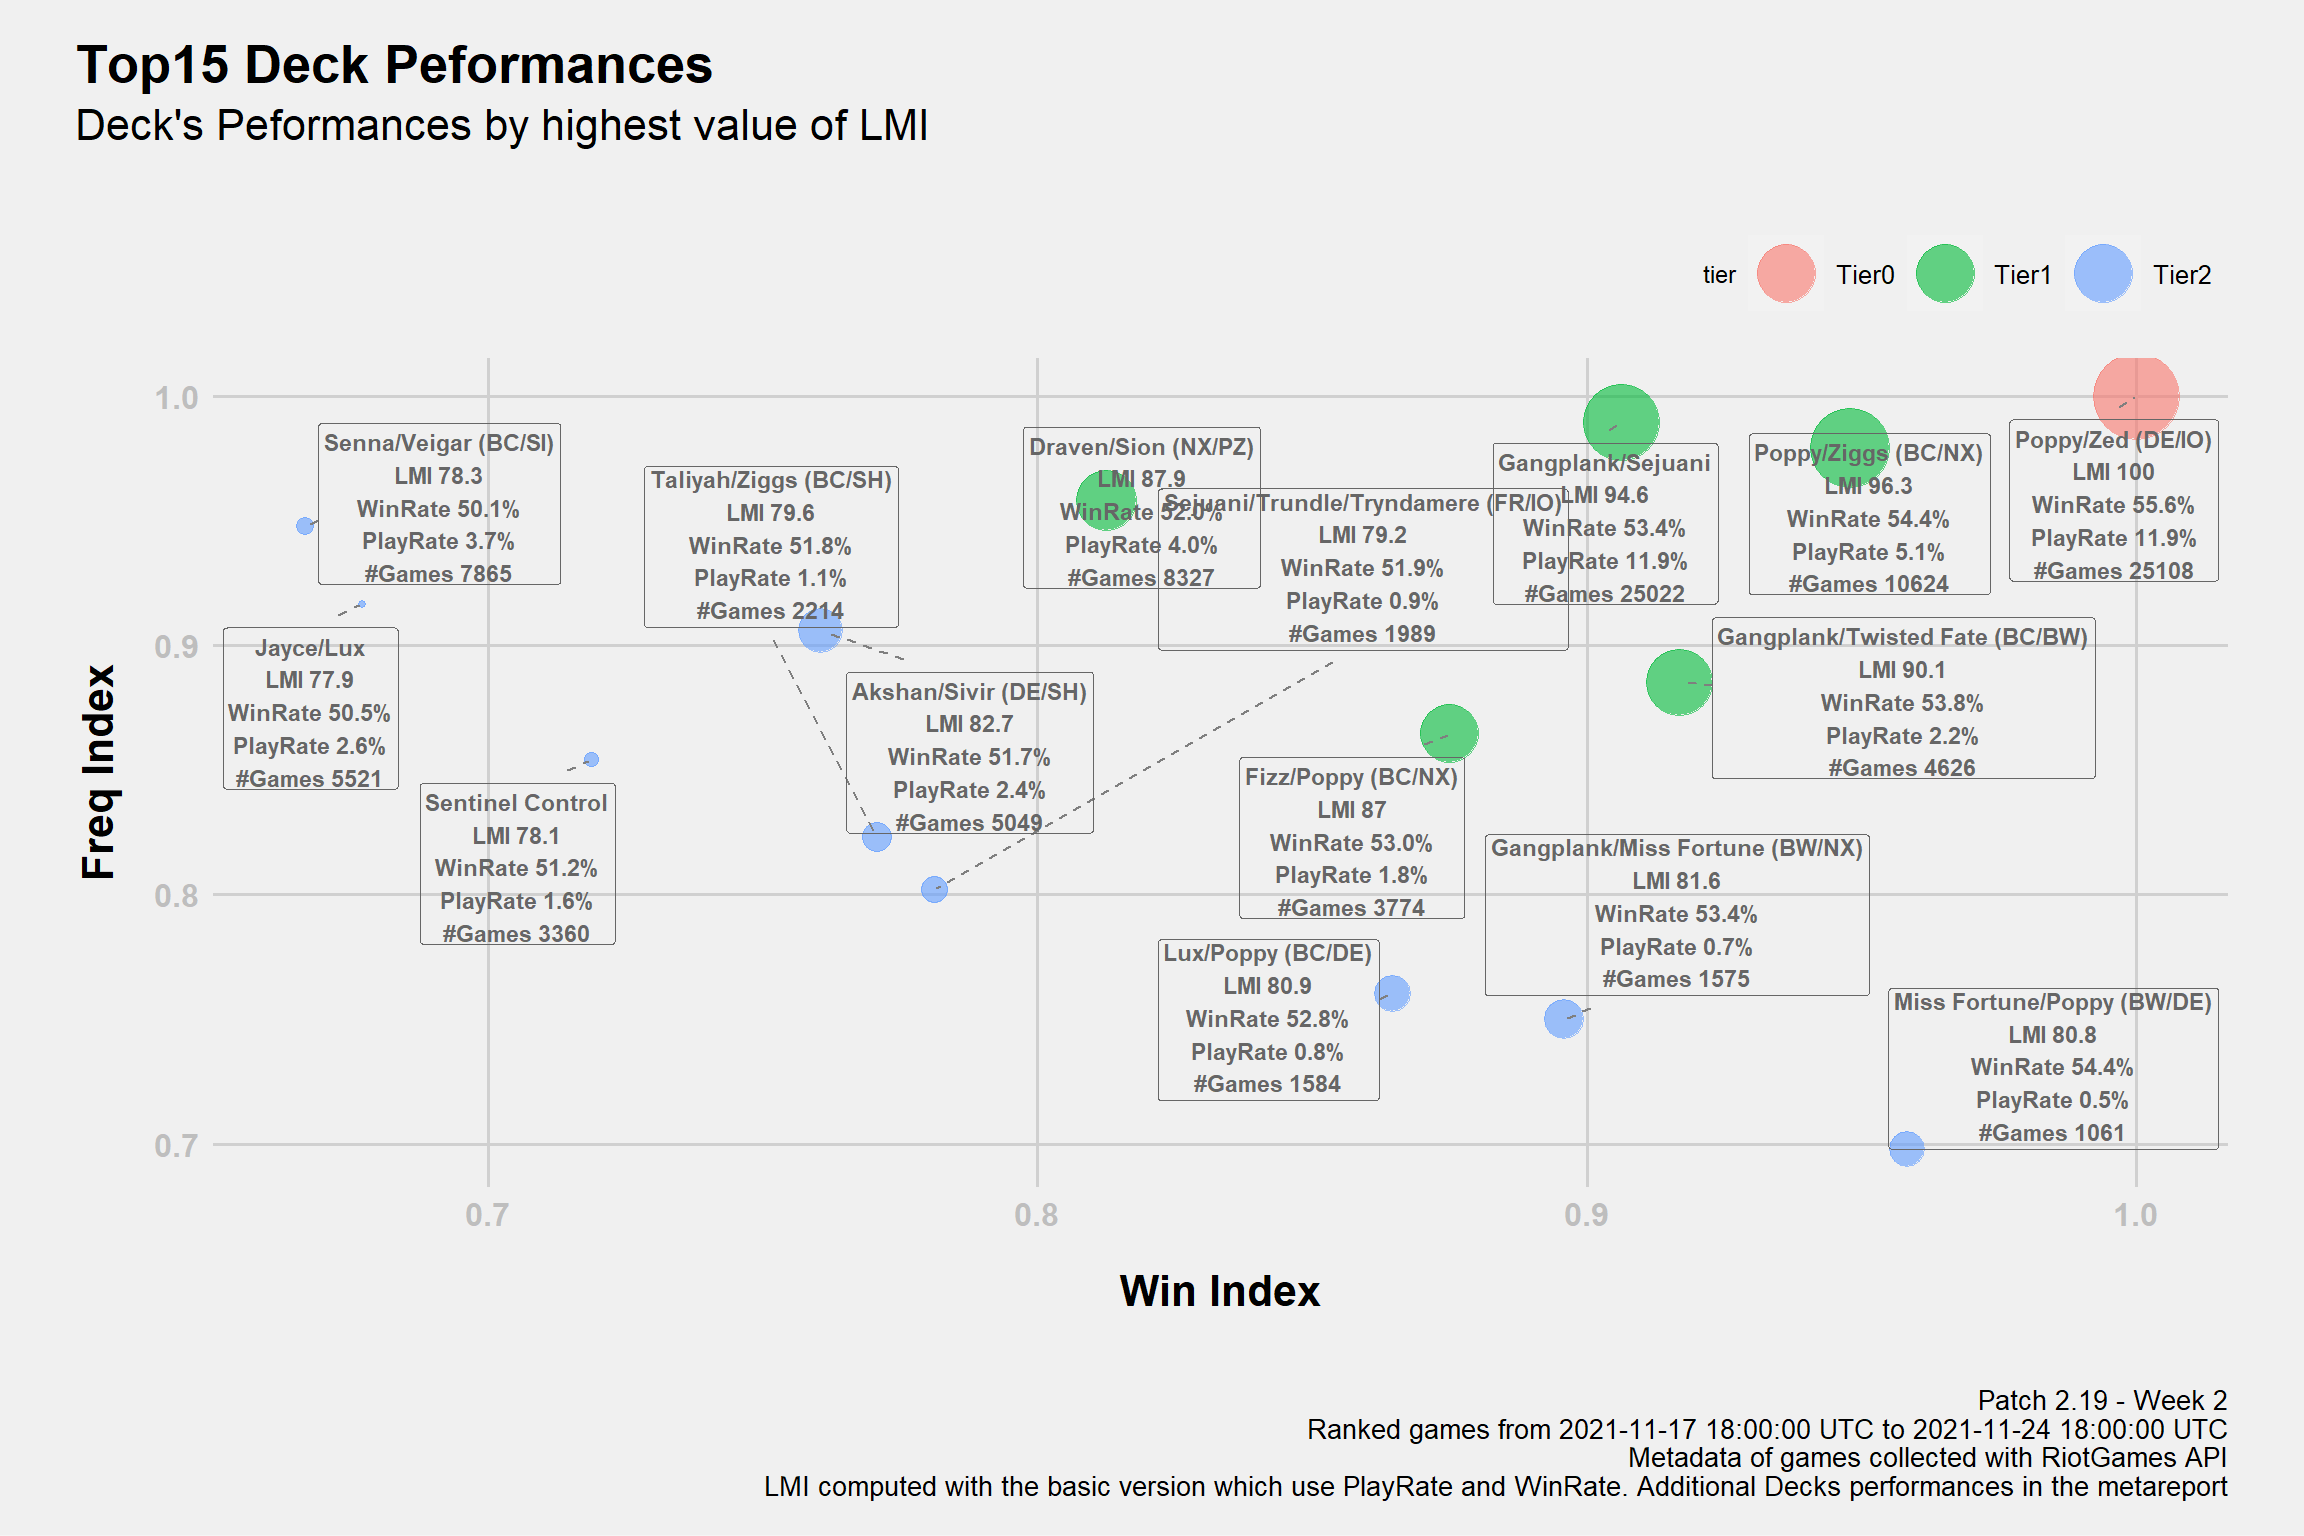
LoR-Meta Index (LMI)
Tier0 with LMI >= 97.5
Tier1 with LMI ∈ [85,97.5)
Tier2 with LMI ∈ [60,85)
Tier3 or lower with LMI < 60
The LMI
2 is an Index I developed to measure the performance of decks in the metagame. For those who are familiar with basic statistical concept I wrote a document to explain the theory behind it: , it’s very similar to vicioussyndicate (vS) Meta Score from their data reaper report. The score of each deck is not just their “strength”, it takes in consideration both play rates and win rates that’s why I prefer to say it measure the “performance”. The values range from 0 to 100 and the higher the value, the higher is the performance. 3
Win Marathons Leaders
Top3 Players (or more in case of ties) from each server that had the highest amount of consecutive wins with the same archetype. The provided deckcode is the one played in the last win found.
| Top3 Biggest Win Streak by Server | |||
|---|---|---|---|
| Cumulative wins with the same Archetype | |||
| Player | Result | Archetype | Deck Code |
| Americas | |||
| Fogacinha | 15 | Thresh/Viego (IO/SI) | |
| Fufusnag | 14 | Taliyah/Ziggs (BC/SH) | |
| Black Axis | 13 | Pyke/Rek'Sai | |
| DasPerin11 | 13 | Gangplank/Sejuani | |
| Sir DiegoADM | 13 | Gangplank/Miss Fortune (BW/NX) | |
| Asia | |||
| 서폿쌤 | 15 | Fizz/Poppy (BC/NX) | |
| astro | 13 | Gangplank/Sejuani | |
| 북미 판다곰 | 12 | Fizz/Lulu/Poppy (BC/NX) | |
| 이렐리아 | 12 | Poppy/Zed (DE/IO) | |
| Europe | |||
| NA | 18 | Poppy/Zed (DE/IO) | |
| Stroppo83 | 16 | Lulu/Poppy (DE/IO) | |
| bubblefish | 14 | Lux/Poppy (BC/DE) | |
| Cyrano86 | 14 | Gangplank/Sejuani | |
| Eclipse | 14 | Draven/Sion (NX/PZ) | |
| Games from all Master are collected each hour adding up to the last 20 matches. Unlikely but possible to miss games in case of high frequency games. Metadata of games collected with RiotGames API | |||
Cards Presence
It seems that not even Twin Disciple can beat Sharsight
Cards that couldn’t find place even in a meme deck.
Legal bla bla
This content was created under Riot Games ‘Legal Jibber Jabber’ policy using assets owned by Riot Games. Riot Games does not endorse or sponsor this project.