Data
Number of Master Players: 14073
Number of HighDiamond 1 Players: 14298
Number of (Ranked) Master matches analysed 206787 or 413574 games.
Number of (Ranked) ~HighDiamond matches analysed 270219 or 540438 games.
Last Update: 2022-11-30 20:06
Games
| Patch 3.20 - Week 1 - by the Numbers1 | ||||
| Characteristic | Master2 | ~HighDiamond2 | ||
|---|---|---|---|---|
| N = 454,1123 | N = 206,7873 | N = 444,6503 | N = 270,2193 | |
| Status | ||||
| Ranked | 206,787 (46%) | 270,219 (61%) | ||
| ThePathOfChampions | 133,100 (29%) | 103,203 (23%) | ||
| Other | 104,632 (23%) | 64,927 (15%) | ||
| Labs | 5,890 (1.3%) | 4,816 (1.1%) | ||
| Friendly Bo3 | 3,703 (0.8%) | 1,485 (0.3%) | ||
| Server | ||||
| Americas | 176,871 (39%) | 80,488 (39%) | 162,000 (36%) | 102,759 (38%) |
| Apac | 129,651 (29%) | 54,448 (26%) | 130,528 (29%) | 71,539 (26%) |
| Europe | 147,590 (33%) | 71,851 (35%) | 152,122 (34%) | 95,921 (35%) |
| 1 Max datetime recovered: 2022-11-30 16:23:00.641768 UTC from 2022-11-23 18:00:00 to 2022-11-30 18:00:00 UTC | ||||
| 2 EU Master 4814/4826 NA Master 5638/5671 APAC Master 3621/3629 | ||||
| 3 n(%) took from the number of matches. When the data is analysed the size is double since we account each different player | ||||
Account
| Shard/Server | Total | |||
|---|---|---|---|---|
| Americas | Apac | Europe | ||
| Player Rank | ||||
| Master | 5,638 (20%) | 3,621 (13%) | 4,814 (17%) | 14,073 (50%) |
| Diamond | 5,378 (19%) | 4,046 (14%) | 4,874 (17%) | 14,298 (50%) |
| Total | 11,016 (39%) | 7,667 (27%) | 9,688 (34%) | 28,371 (100%) |
Regions
Play Rate
Plot
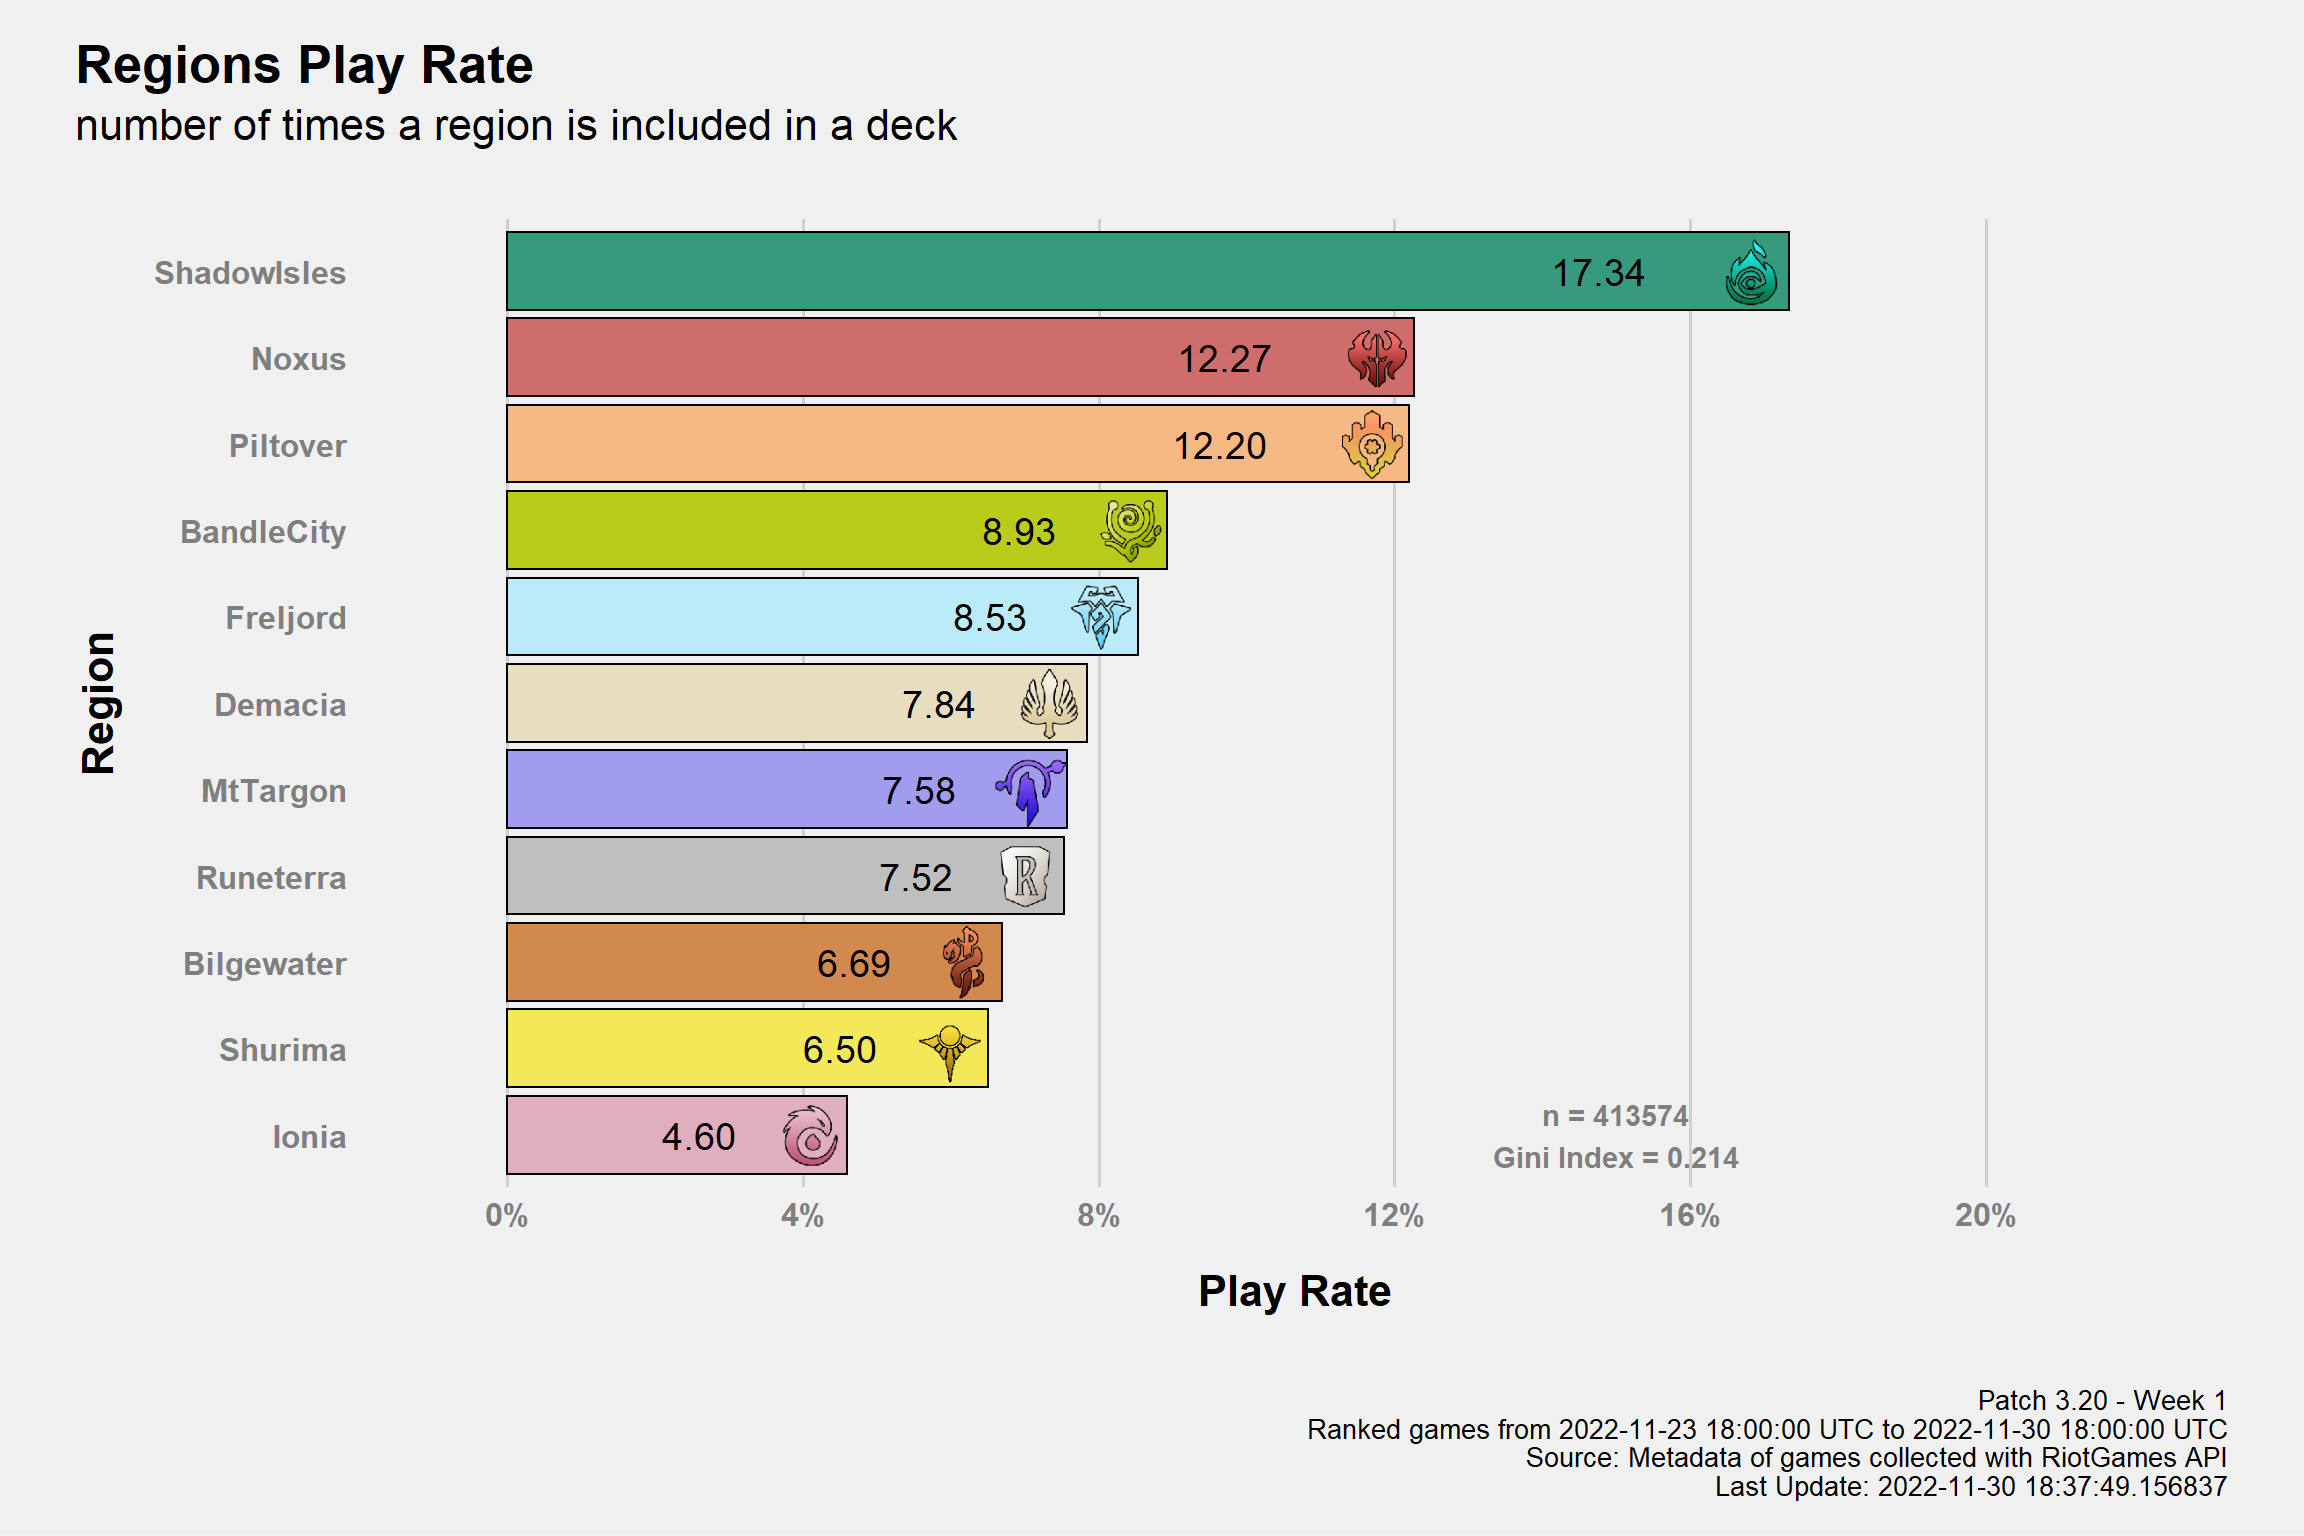
The Gini Index is a measure of heterogeneity so, in this case and in simpler terms, how much the play rates are similar. The Index goes (when normalized like here) \(\in [0, 1]\) and it’s equal to 1 when there’s a single value with 100% play rate or 0 when all play rates are equal. Of course a Gini Index of 1 needs to be avoided but it’s not like the aim should be 0. As said, it’s just to add some additional tools.
Table
| Region Play Rate | ||||
| Relative Frequencies by Inclusion Rate of a Region | ||||
| Freq | Shard | |||
|---|---|---|---|---|
| America | Apac | Europe | ||
| Regions | ||||
| ShadowIsles | 17.34% | 17.37% | 16.47% | 17.96% |
| Noxus | 12.27% | 12.23% | 11.44% | 12.94% |
| Piltover | 12.20% | 12.14% | 12.72% | 11.87% |
| BandleCity | 8.93% | 8.92% | 8.21% | 9.48% |
| Freljord | 8.53% | 9.05% | 8.67% | 7.85% |
| Demacia | 7.84% | 7.81% | 8.10% | 7.68% |
| MtTargon | 7.58% | 7.75% | 7.08% | 7.76% |
| Bilgewater | 6.69% | 6.13% | 7.31% | 6.84% |
| Shurima | 6.50% | 6.54% | 6.98% | 6.09% |
| Ionia | 4.60% | 4.60% | 5.42% | 3.98% |
| Runeterra | ||||
| Kayn | 3.49% | 3.36% | 3.53% | 3.60% |
| Varus | 1.63% | 1.51% | 1.70% | 1.71% |
| Jhin | 1.23% | 1.33% | 1.15% | 1.17% |
| Bard | 0.43% | 0.50% | 0.32% | 0.43% |
| Jax | 0.38% | 0.31% | 0.54% | 0.34% |
| Evelynn | 0.37% | 0.45% | 0.37% | 0.29% |
| total | 7.52% | 7.46% | 7.61% | 7.54% |
| Patch 3.20 - Week 1 Ranked games from 2022-11-23 18:00:00 UTC to 2022-11-30 18:00:00 UTC Source: Metadata of games collected with RiotGames API Last Update: 2022-11-30 18:37:49.156837 | ||||
Play Rate by number of Cards
Plot
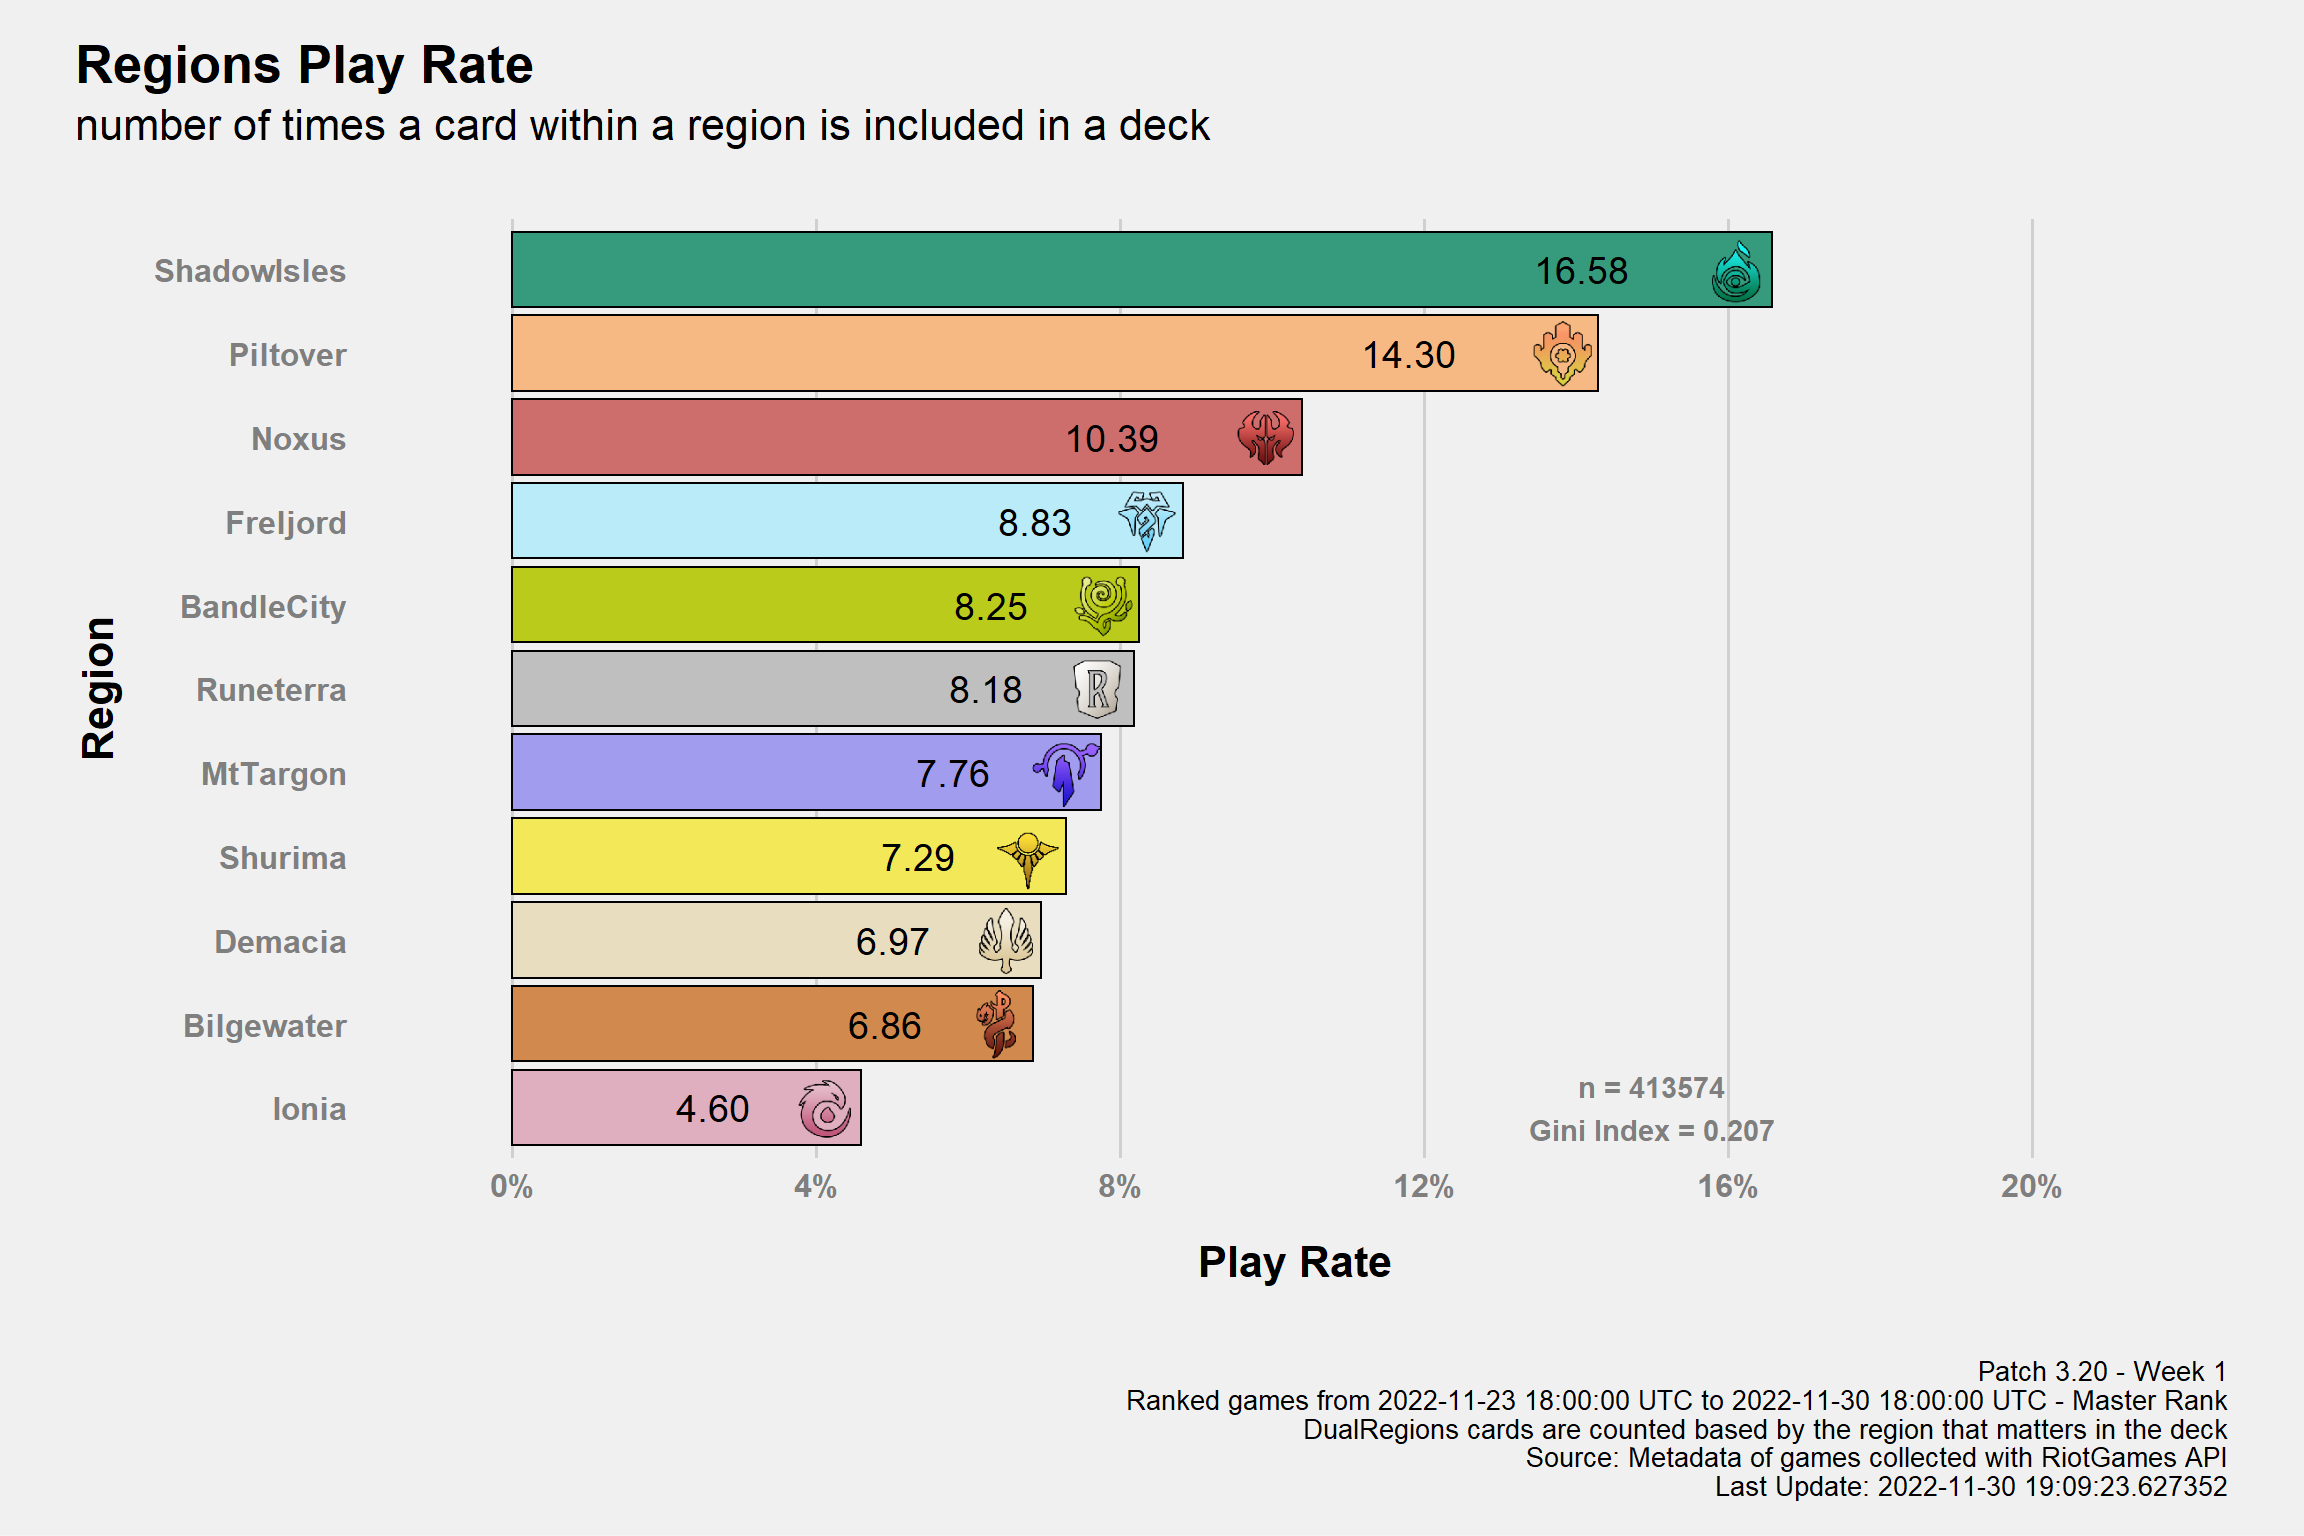
Table
| Region Play Rate | ||||
| Relative Frequencies by number of times a Card within a Region is included in a Deck | ||||
| Freq | Shard | |||
|---|---|---|---|---|
| America | Apac | Europe | ||
| Regions | ||||
| ShadowIsles | 16.58% | 16.34% | 16.15% | 17.16% |
| Piltover | 14.30% | 14.22% | 14.72% | 14.07% |
| Noxus | 10.39% | 10.37% | 9.54% | 11.06% |
| Freljord | 8.83% | 9.71% | 8.96% | 7.74% |
| BandleCity | 8.25% | 8.15% | 7.32% | 9.08% |
| Runeterra | 8.18% | 8.05% | 8.24% | 8.28% |
| MtTargon | 7.76% | 8.12% | 7.03% | 7.89% |
| Shurima | 7.29% | 7.32% | 8.02% | 6.71% |
| Demacia | 6.97% | 6.89% | 7.15% | 6.91% |
| Bilgewater | 6.86% | 6.31% | 7.11% | 7.28% |
| Ionia | 4.60% | 4.50% | 5.77% | 3.81% |
| Patch 3.20 - Week 1 Ranked games from 2022-11-23 18:00:00 UTC to 2022-11-30 18:00:00 UTC Source: Metadata of games collected with RiotGames API Last Update: 2022-11-30 18:37:49.156837 | ||||
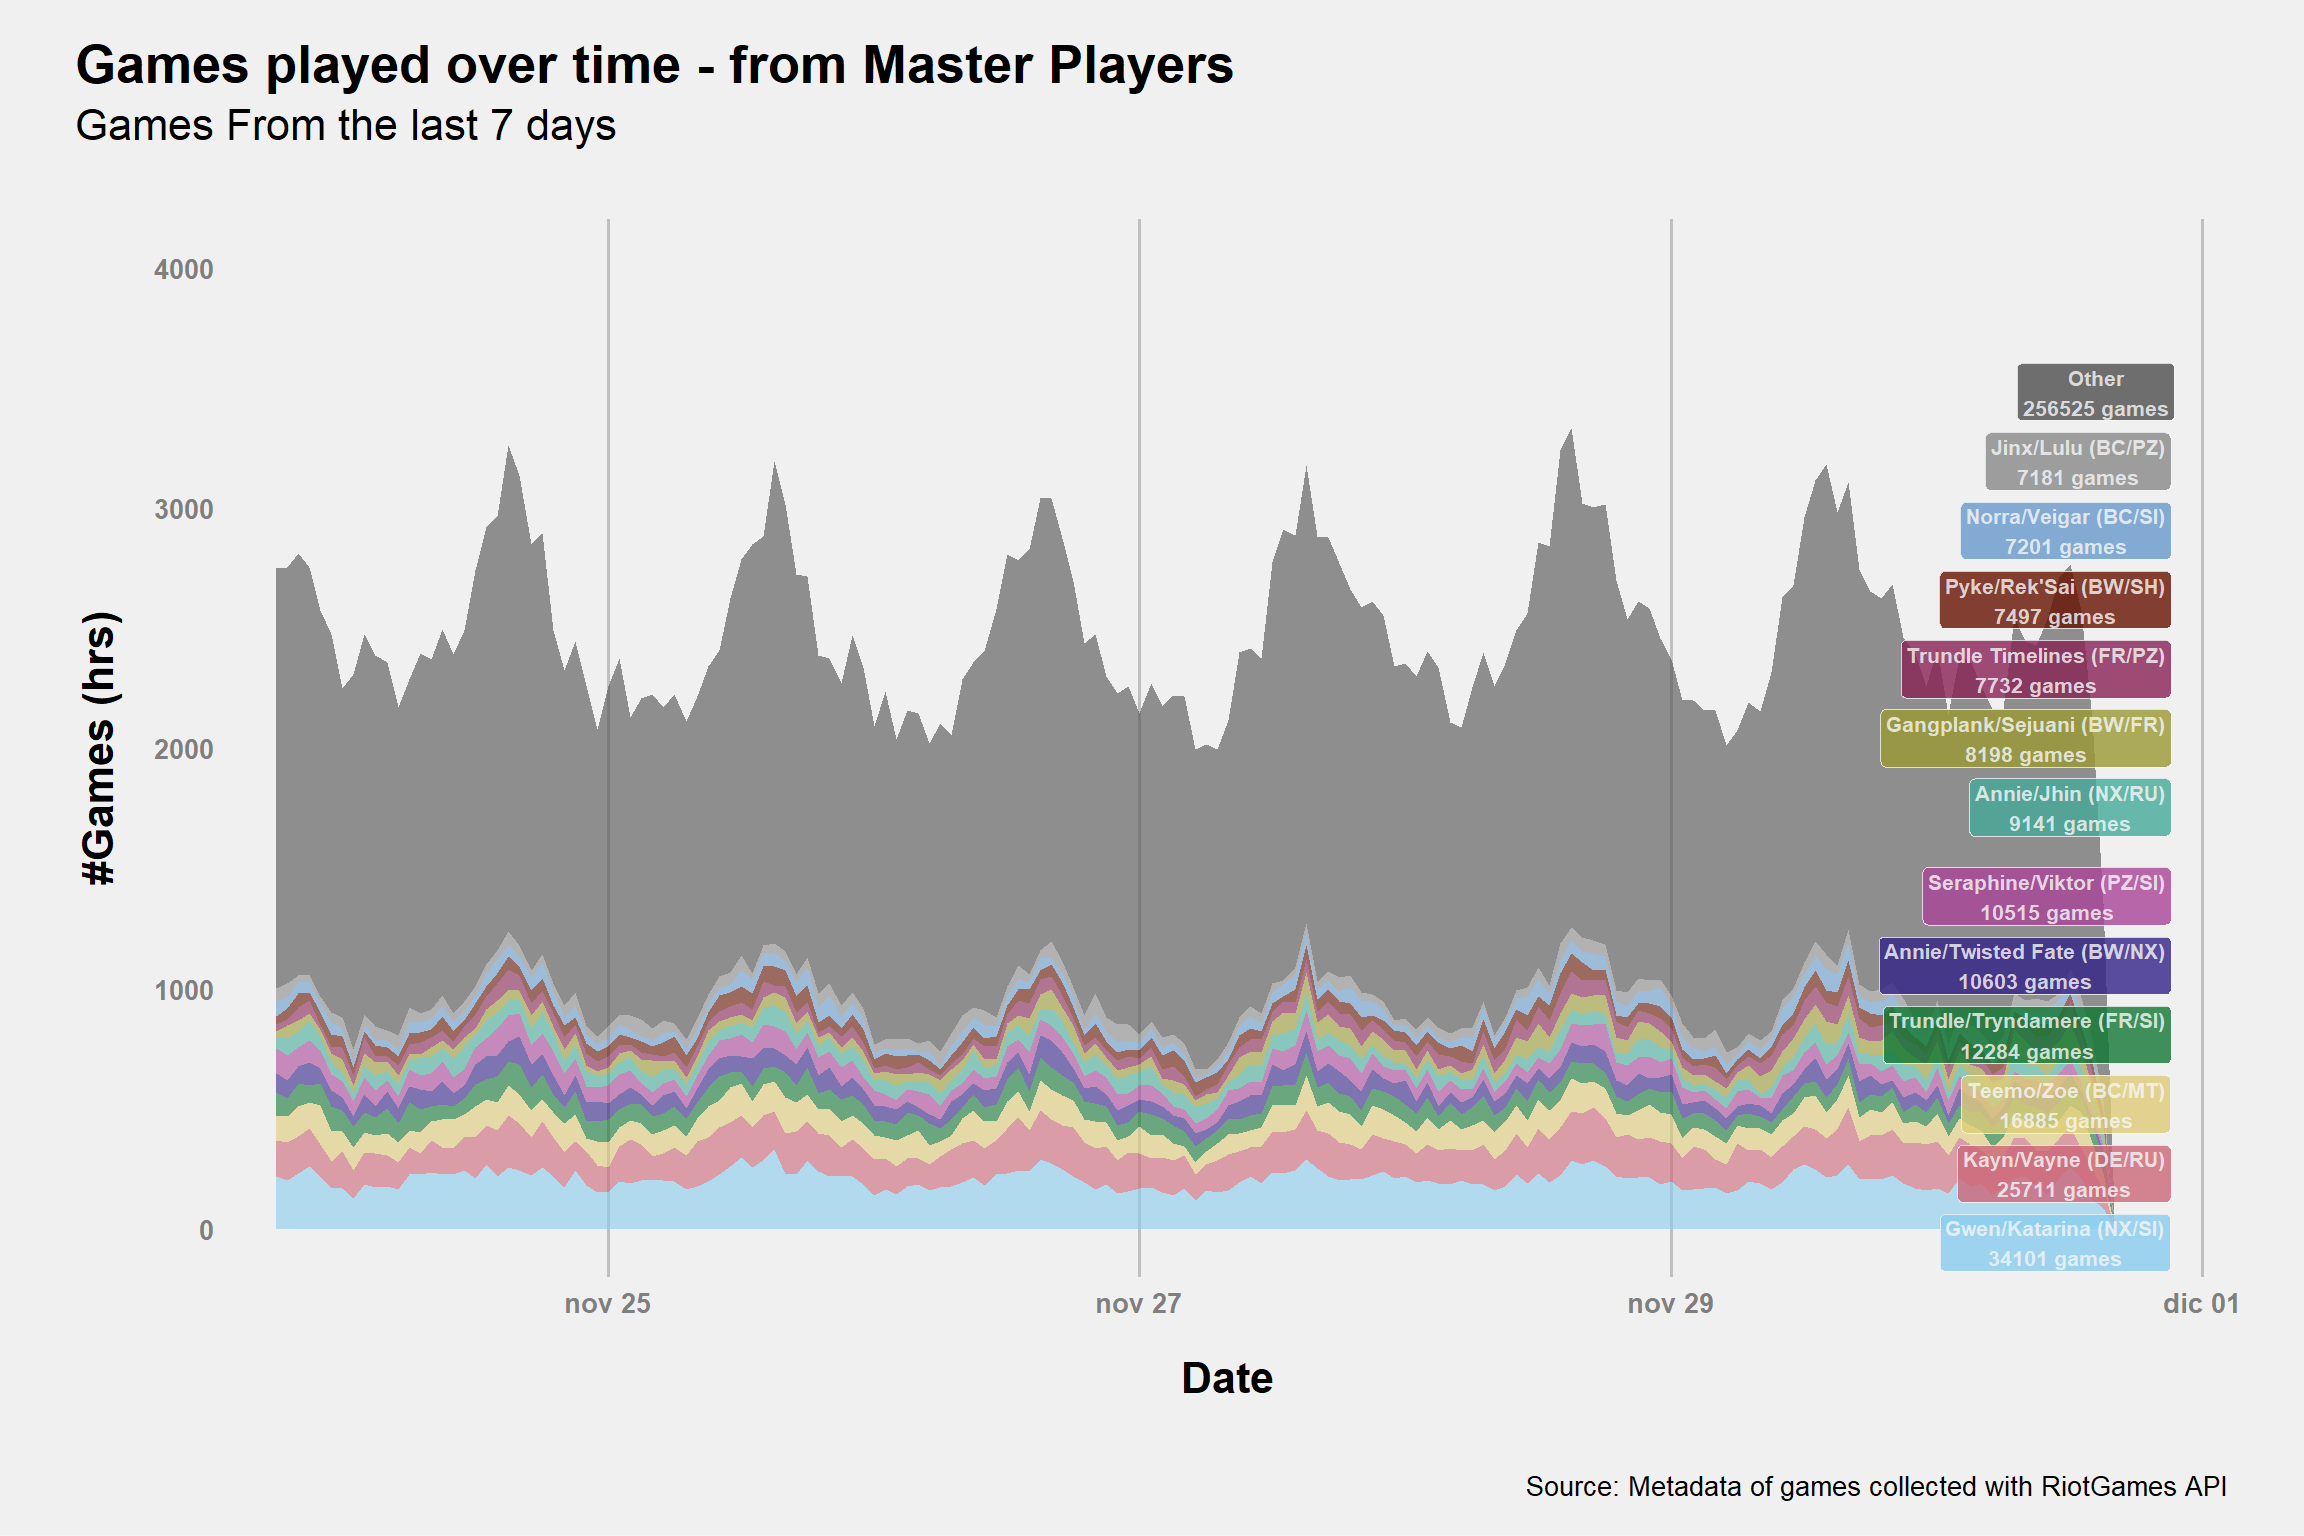
Champions Combinations
Play Rates
Plot
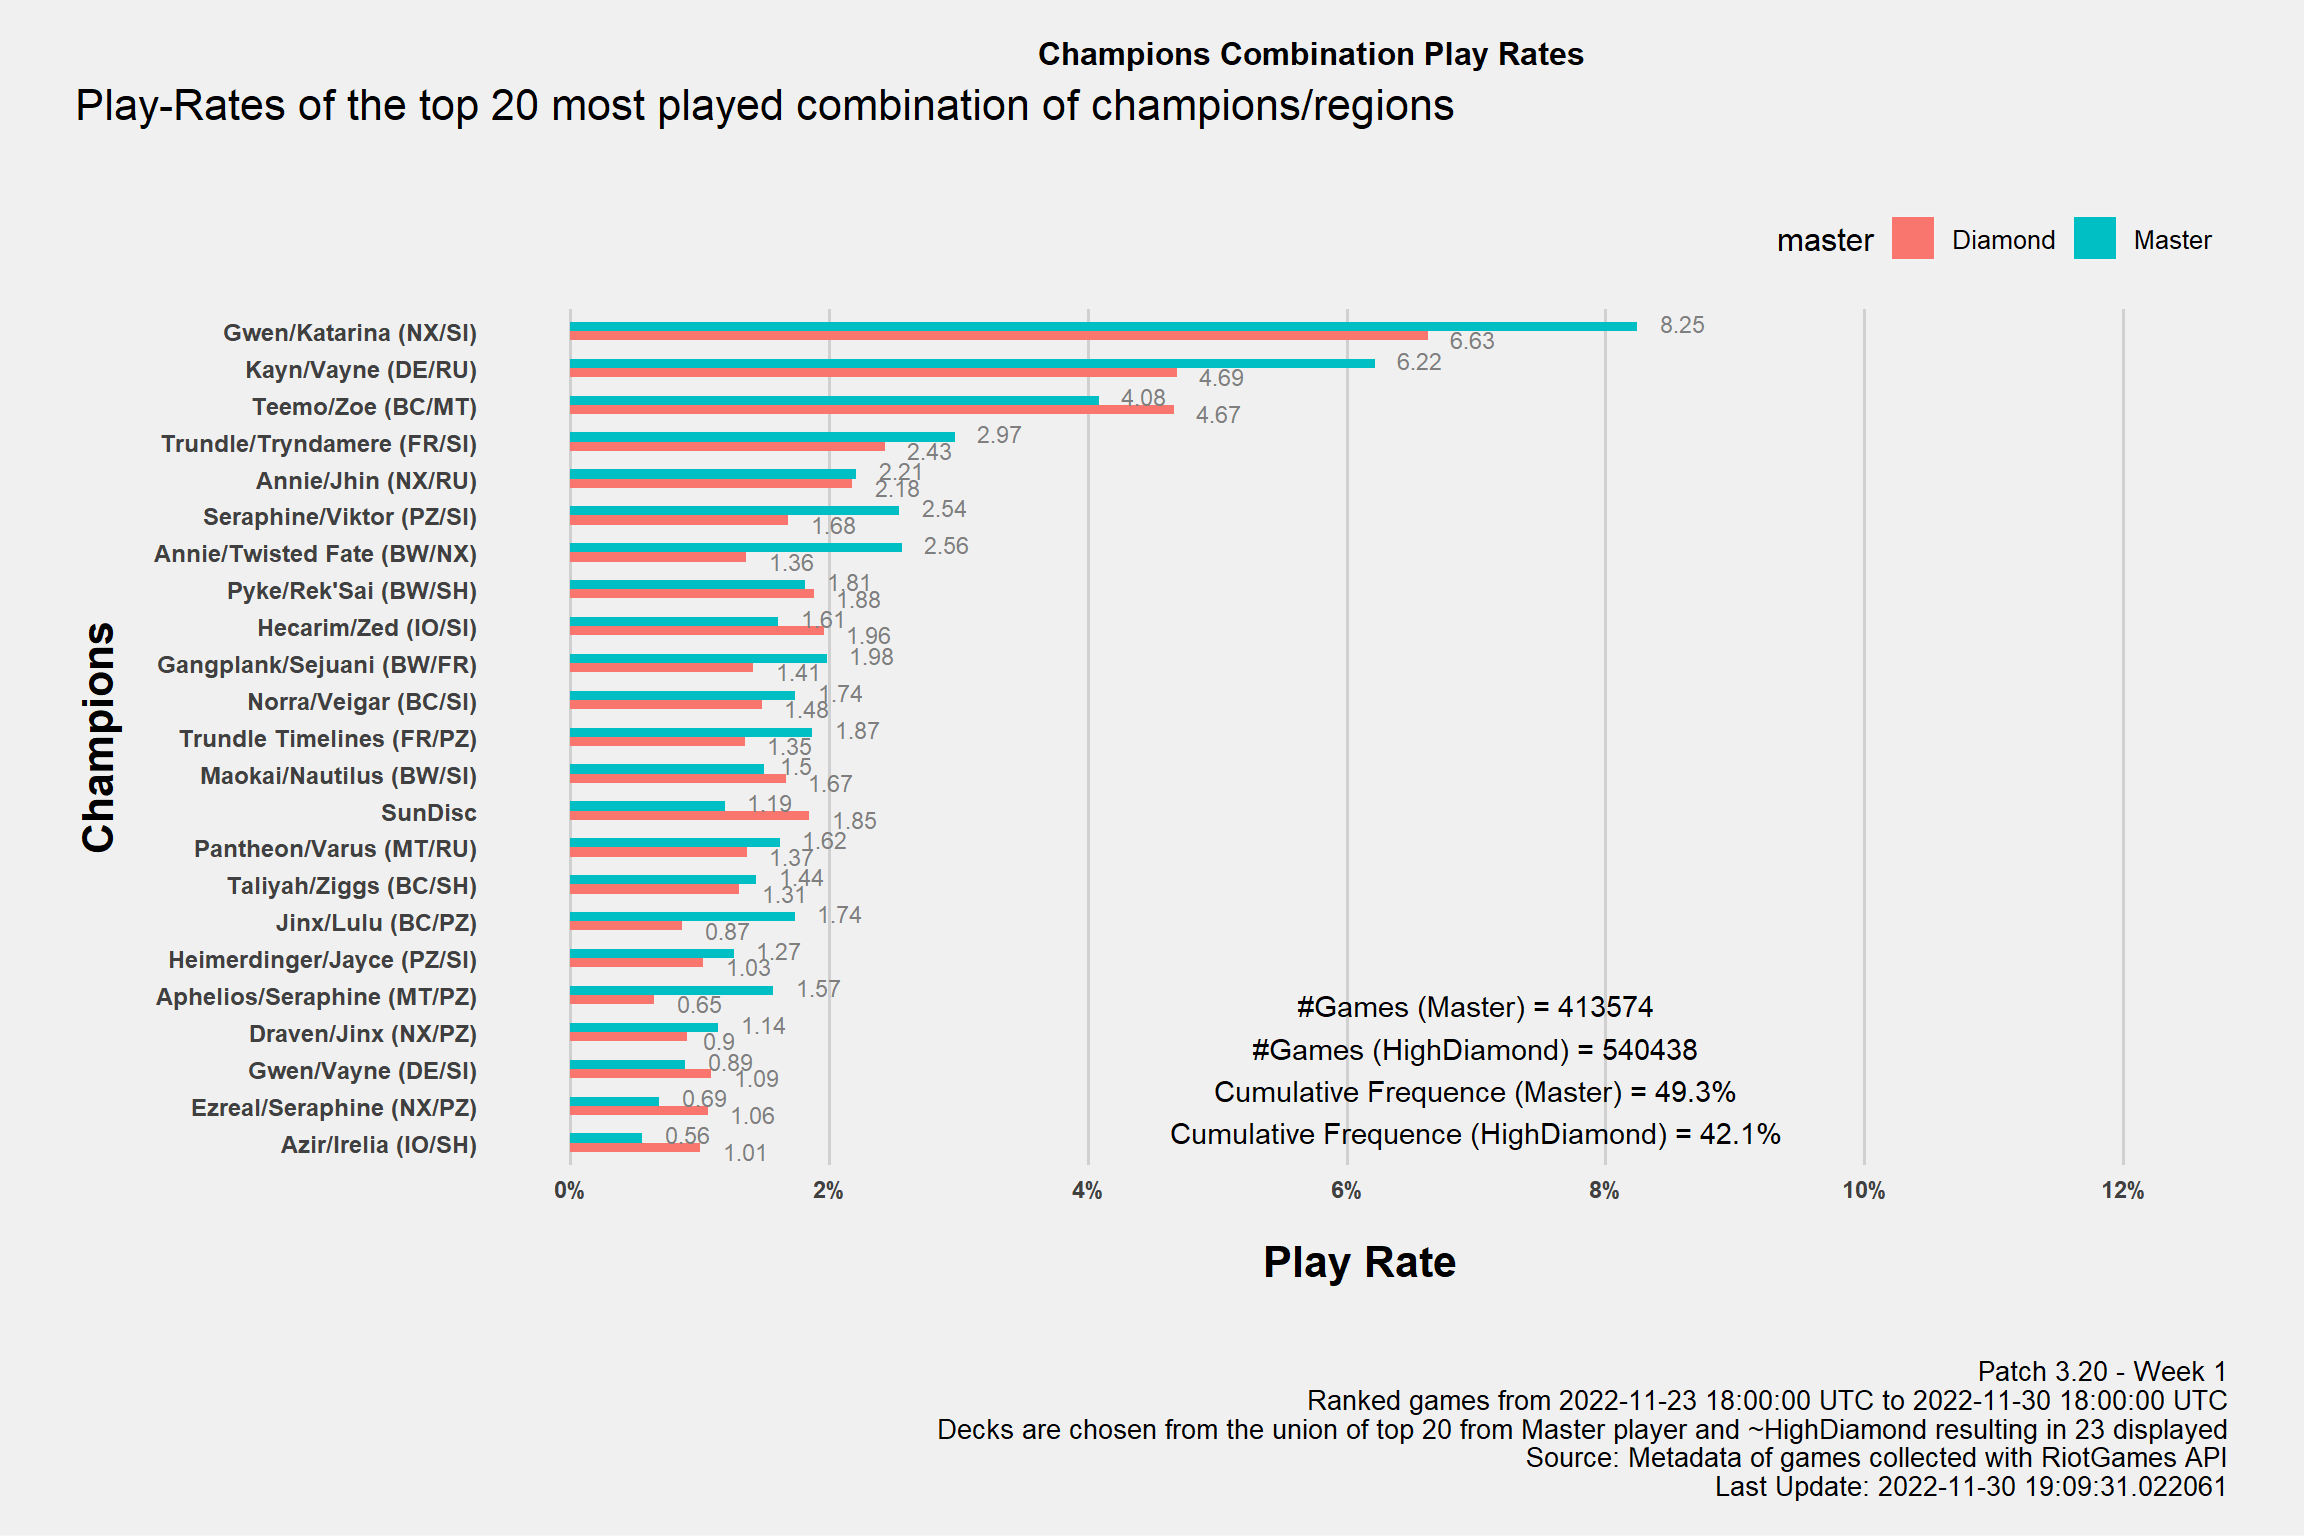
from Master
Source: Metadata of games collected with RiotGames API. Last Update: 2022-11-30 19:09:34.474117 FALSE
from Diamond
Source: Metadata of games collected with RiotGames API. Last Update: 2022-11-30 19:09:35.833632 FALSE
Day by day
Hourly/Dialy lines
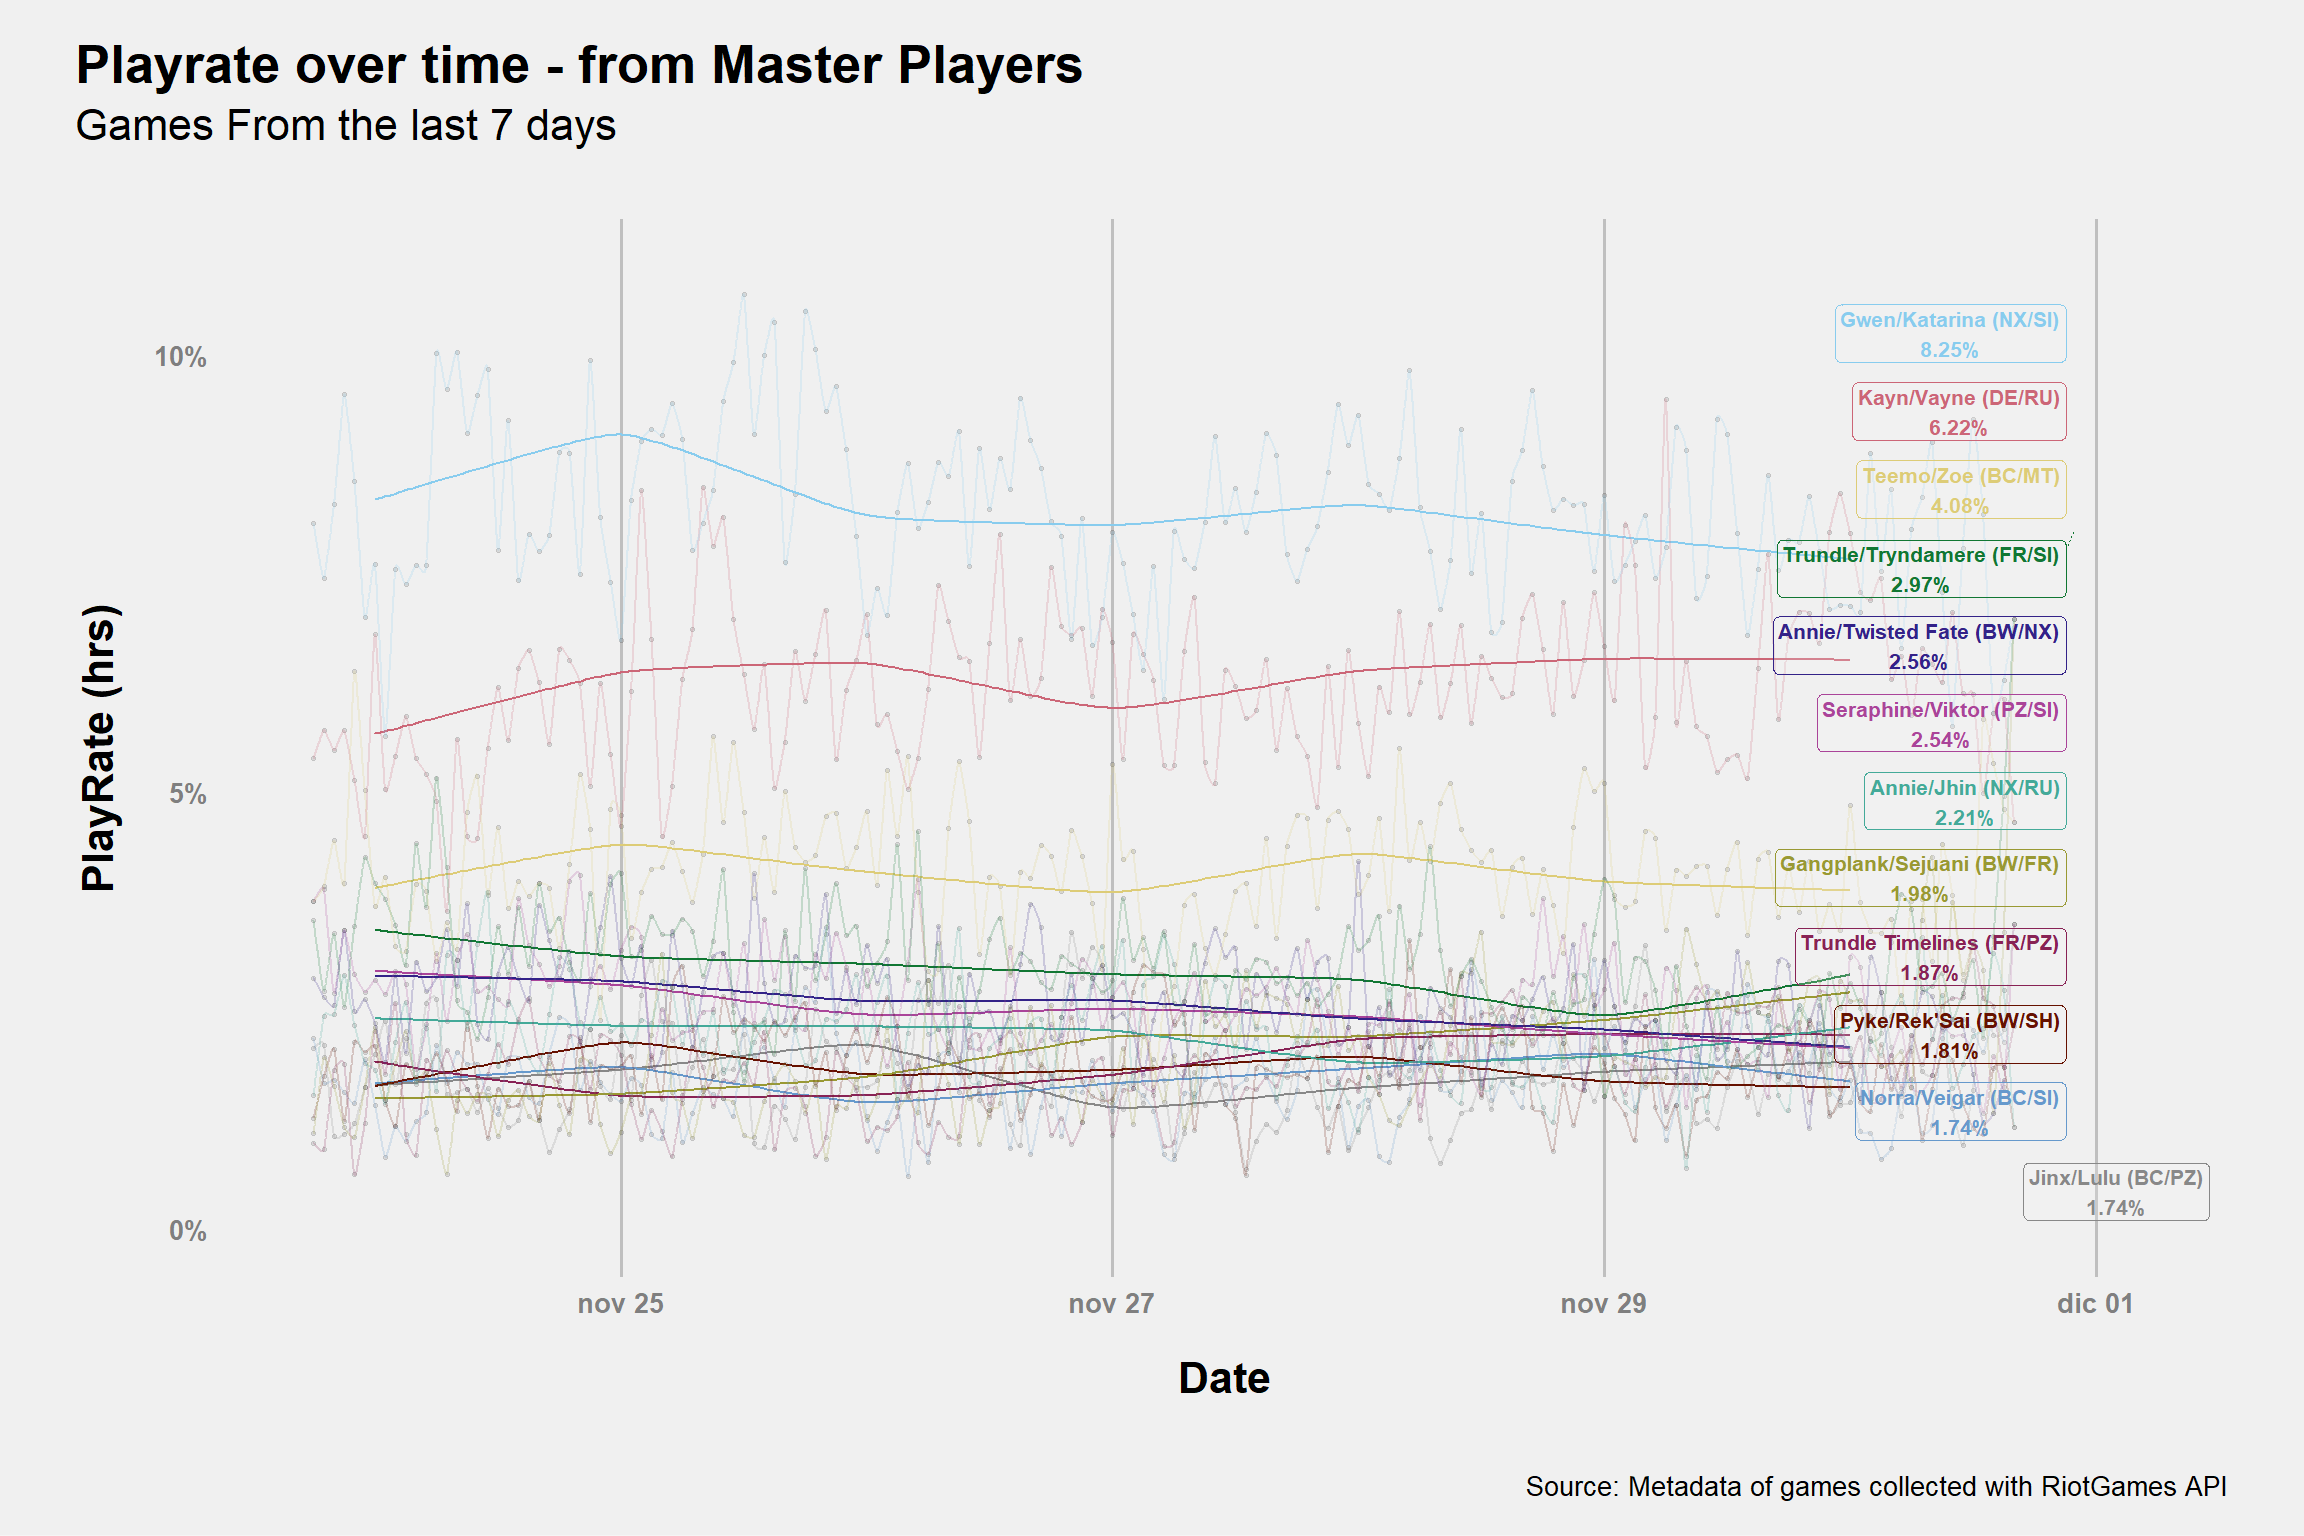
Stacked Playrates
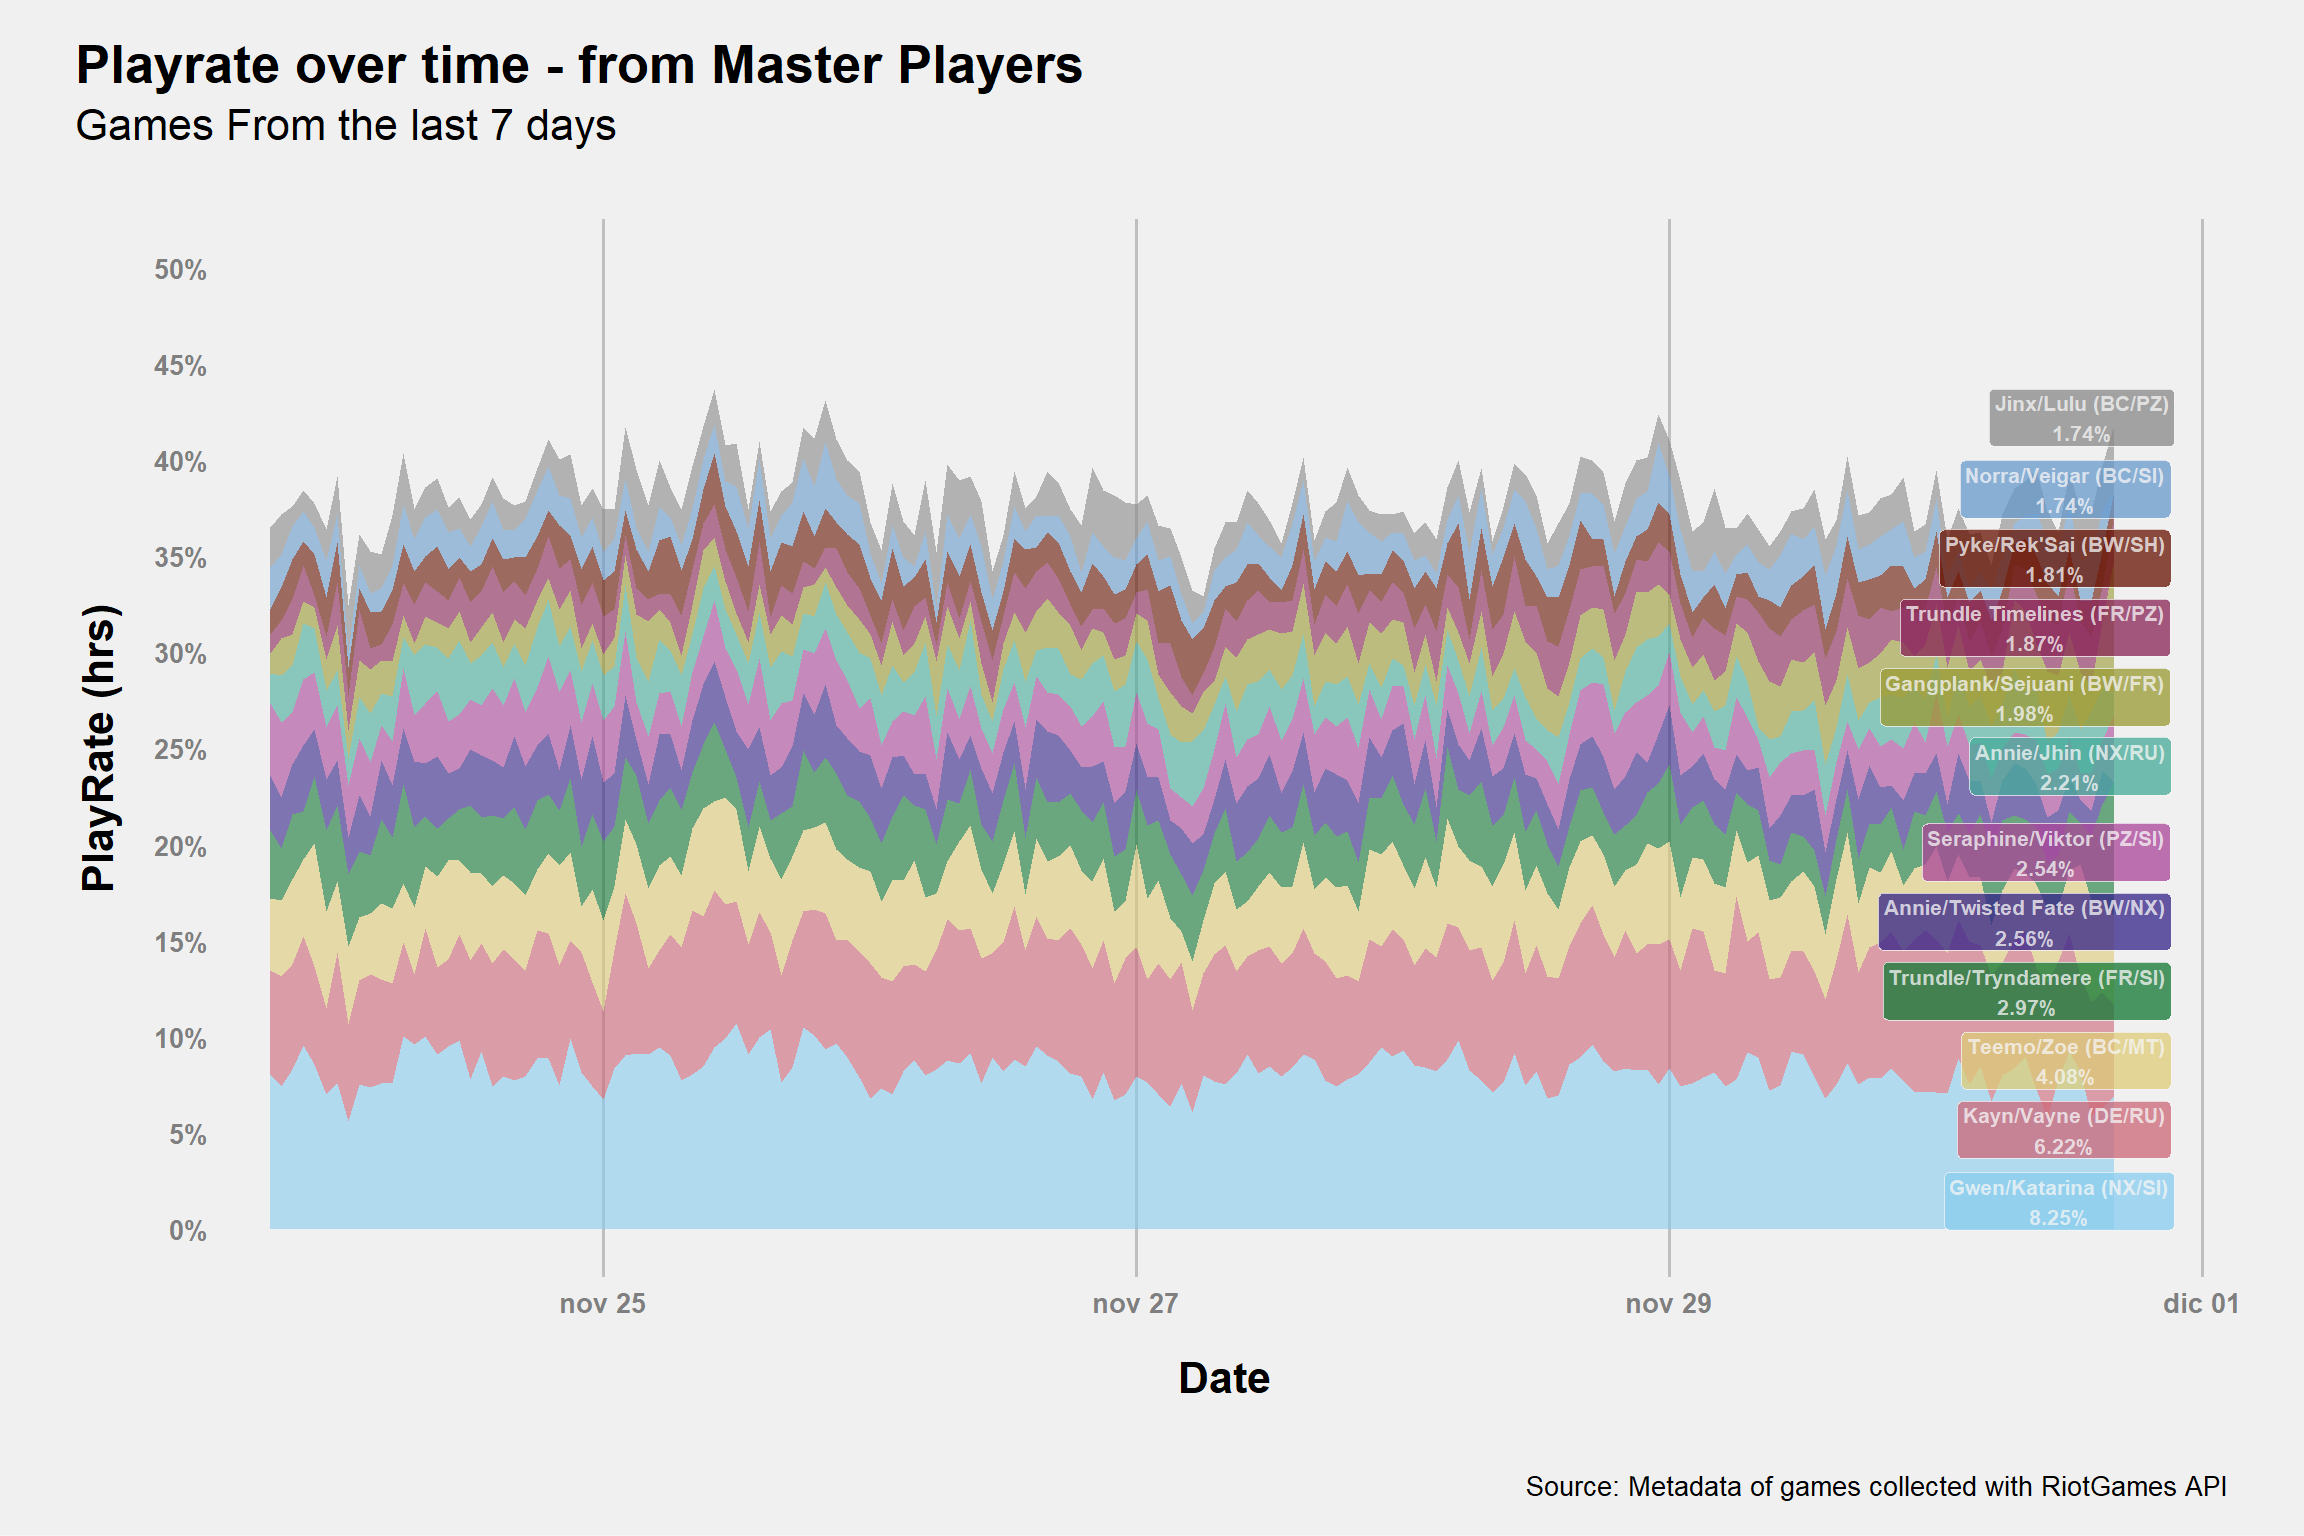
Each playrate is stacked upon the other with the decks with the highest overall play-rate (the written value) being at the bottom.
Stacked Games
Win Rates
Meta Decks
Win rates of the most played combination of champions. Play Rate \(\geq 1\%\) in at least one of the servers.
Format changed to replicate the one used in the Meta - page
Underdog
Top Win rates of the top10 best performing least played combination of champions. Play rate \(\in [0.1%, 1%)\)
Match Ups
Regarding MU, this is not the most accurate estimation you can get from my data. If you want a better picture of the current meta it would be better to look at the dedicated MU-page where I use all “Ranked” games with the current sets of buffs and nerfs. While one may object I don’t account for optimizations and differences in skills acquired during the weeks, the overall number of games / sample size makes them a better source of information. So, in case, please refer to the MU - page for a better “meta-investigation”.
Match-up Grid
The win rates on the grid are among the 10 most played champion combination.
| WR (WRmeta) | Gwen/Katarina (NX/SI) | Kayn/Vayne (DE/RU) | Teemo/Zoe (BC/MT) | Trundle/Tryndamere (FR/SI) | Annie/Twisted Fate (BW/NX) | Seraphine/Viktor (PZ/SI) | Annie/Jhin (NX/RU) | Gangplank/Sejuani (BW/FR) | Trundle Timelines (FR/PZ) | Pyke/Rek'Sai (BW/SH) | |
|---|---|---|---|---|---|---|---|---|---|---|---|
| Gwen/Katarina (NX/SI) | 56.0%
52.7% |
NA
NA |
47.0%
(44.8% - 49.1%) |
50.4%
(47.9% - 53.0%) |
55.5%
(52.3% - 58.6%) |
50.6%
(47.3% - 53.9%) |
63.8%
(60.6% - 67.0%) |
56.8%
(53.2% - 60.4%) |
48.7%
(44.9% - 52.5%) |
59.1%
(55.1% - 63.0%) |
63.3%
(59.3% - 67.2%) |
| Kayn/Vayne (DE/RU) | 56.0%
51.6% |
53.0%
(50.9% - 55.2%) |
NA
NA |
46.4%
(43.4% - 49.4%) |
50.8%
(47.3% - 54.3%) |
41.0%
(37.3% - 44.7%) |
52.7%
(48.9% - 56.4%) |
45.4%
(41.3% - 49.5%) |
59.3%
(54.9% - 63.7%) |
47.8%
(43.4% - 52.3%) |
46.4%
(41.7% - 51.2%) |
| Teemo/Zoe (BC/MT) | 55.7%
51.4% |
49.6%
(47.0% - 52.1%) |
53.6%
(50.6% - 56.6%) |
NA
NA |
45.7%
(41.2% - 50.2%) |
37.9%
(33.4% - 42.5%) |
50.0%
(45.1% - 54.9%) |
30.9%
(26.3% - 35.9%) |
53.3%
(47.8% - 58.7%) |
69.1%
(63.8% - 74.1%) |
50.2%
(44.4% - 56.0%) |
| Trundle/Tryndamere (FR/SI) | 52.8%
50.0% |
44.5%
(41.4% - 47.7%) |
49.2%
(45.7% - 52.7%) |
54.3%
(49.8% - 58.8%) |
NA
NA |
61.0%
(55.6% - 66.3%) |
58.8%
(53.1% - 64.4%) |
58.0%
(52.2% - 63.6%) |
50.0%
(43.2% - 56.8%) |
31.2%
(25.2% - 37.8%) |
40.7%
(34.6% - 47.1%) |
| Annie/Twisted Fate (BW/NX) | 53.4%
51.3% |
49.4%
(46.1% - 52.7%) |
59.0%
(55.3% - 62.7%) |
62.1%
(57.5% - 66.6%) |
39.0%
(33.7% - 44.4%) |
NA
NA |
42.0%
(36.3% - 47.9%) |
51.8%
(45.0% - 58.6%) |
46.6%
(40.2% - 53.2%) |
44.5%
(37.5% - 51.7%) |
62.7%
(55.9% - 69.1%) |
| Seraphine/Viktor (PZ/SI) | 49.5%
46.1% |
36.2%
(33.0% - 39.4%) |
47.3%
(43.6% - 51.1%) |
50.0%
(45.1% - 54.9%) |
41.2%
(35.6% - 46.9%) |
58.0%
(52.1% - 63.7%) |
NA
NA |
57.5%
(50.7% - 64.2%) |
39.0%
(32.2% - 46.1%) |
33.2%
(27.0% - 39.9%) |
46.2%
(38.8% - 53.7%) |
| Annie/Jhin (NX/RU) | 55.1%
51.3% |
43.2%
(39.6% - 46.8%) |
54.6%
(50.5% - 58.7%) |
69.1%
(64.1% - 73.7%) |
42.0%
(36.4% - 47.8%) |
48.2%
(41.4% - 55.0%) |
42.5%
(35.8% - 49.3%) |
NA
NA |
46.4%
(38.7% - 54.3%) |
73.9%
(66.9% - 80.1%) |
52.4%
(44.5% - 60.2%) |
| Gangplank/Sejuani (BW/FR) | 54.2%
51.0% |
51.3%
(47.5% - 55.1%) |
40.7%
(36.3% - 45.1%) |
46.7%
(41.3% - 52.2%) |
50.0%
(43.2% - 56.8%) |
53.4%
(46.8% - 59.8%) |
61.0%
(53.9% - 67.8%) |
53.6%
(45.7% - 61.3%) |
NA
NA |
57.7%
(50.2% - 65.0%) |
67.1%
(59.0% - 74.5%) |
| Trundle Timelines (FR/PZ) | 49.8%
46.9% |
40.9%
(37.0% - 44.9%) |
52.2%
(47.7% - 56.6%) |
30.9%
(25.9% - 36.2%) |
68.8%
(62.2% - 74.8%) |
55.5%
(48.3% - 62.5%) |
66.8%
(60.1% - 73.0%) |
26.1%
(19.9% - 33.1%) |
42.3%
(35.0% - 49.8%) |
NA
NA |
42.4%
(33.6% - 51.6%) |
| Pyke/Rek'Sai (BW/SH) | 50.7%
46.3% |
36.7%
(32.8% - 40.7%) |
53.6%
(48.8% - 58.3%) |
49.8%
(44.0% - 55.6%) |
59.3%
(52.9% - 65.4%) |
37.3%
(30.9% - 44.1%) |
53.8%
(46.3% - 61.2%) |
47.6%
(39.8% - 55.5%) |
32.9%
(25.5% - 41.0%) |
57.6%
(48.4% - 66.4%) |
NA
NA |
| MatchUp values from Ranked games of Master rank players. Order of the Archetypess based on the playrate. Source: Metadata of games collected with RiotGames API | |||||||||||
LoR-Meta Index (LMI)
Note: Games from Master Rank only
Tier0 with LMI \(\geq\) 97.5 Tier1 with LMI \(\in [85, 97.5)\) Tier2 with LMI \(\in [60, 85)\) Tier3- with LMI \(<\) 60
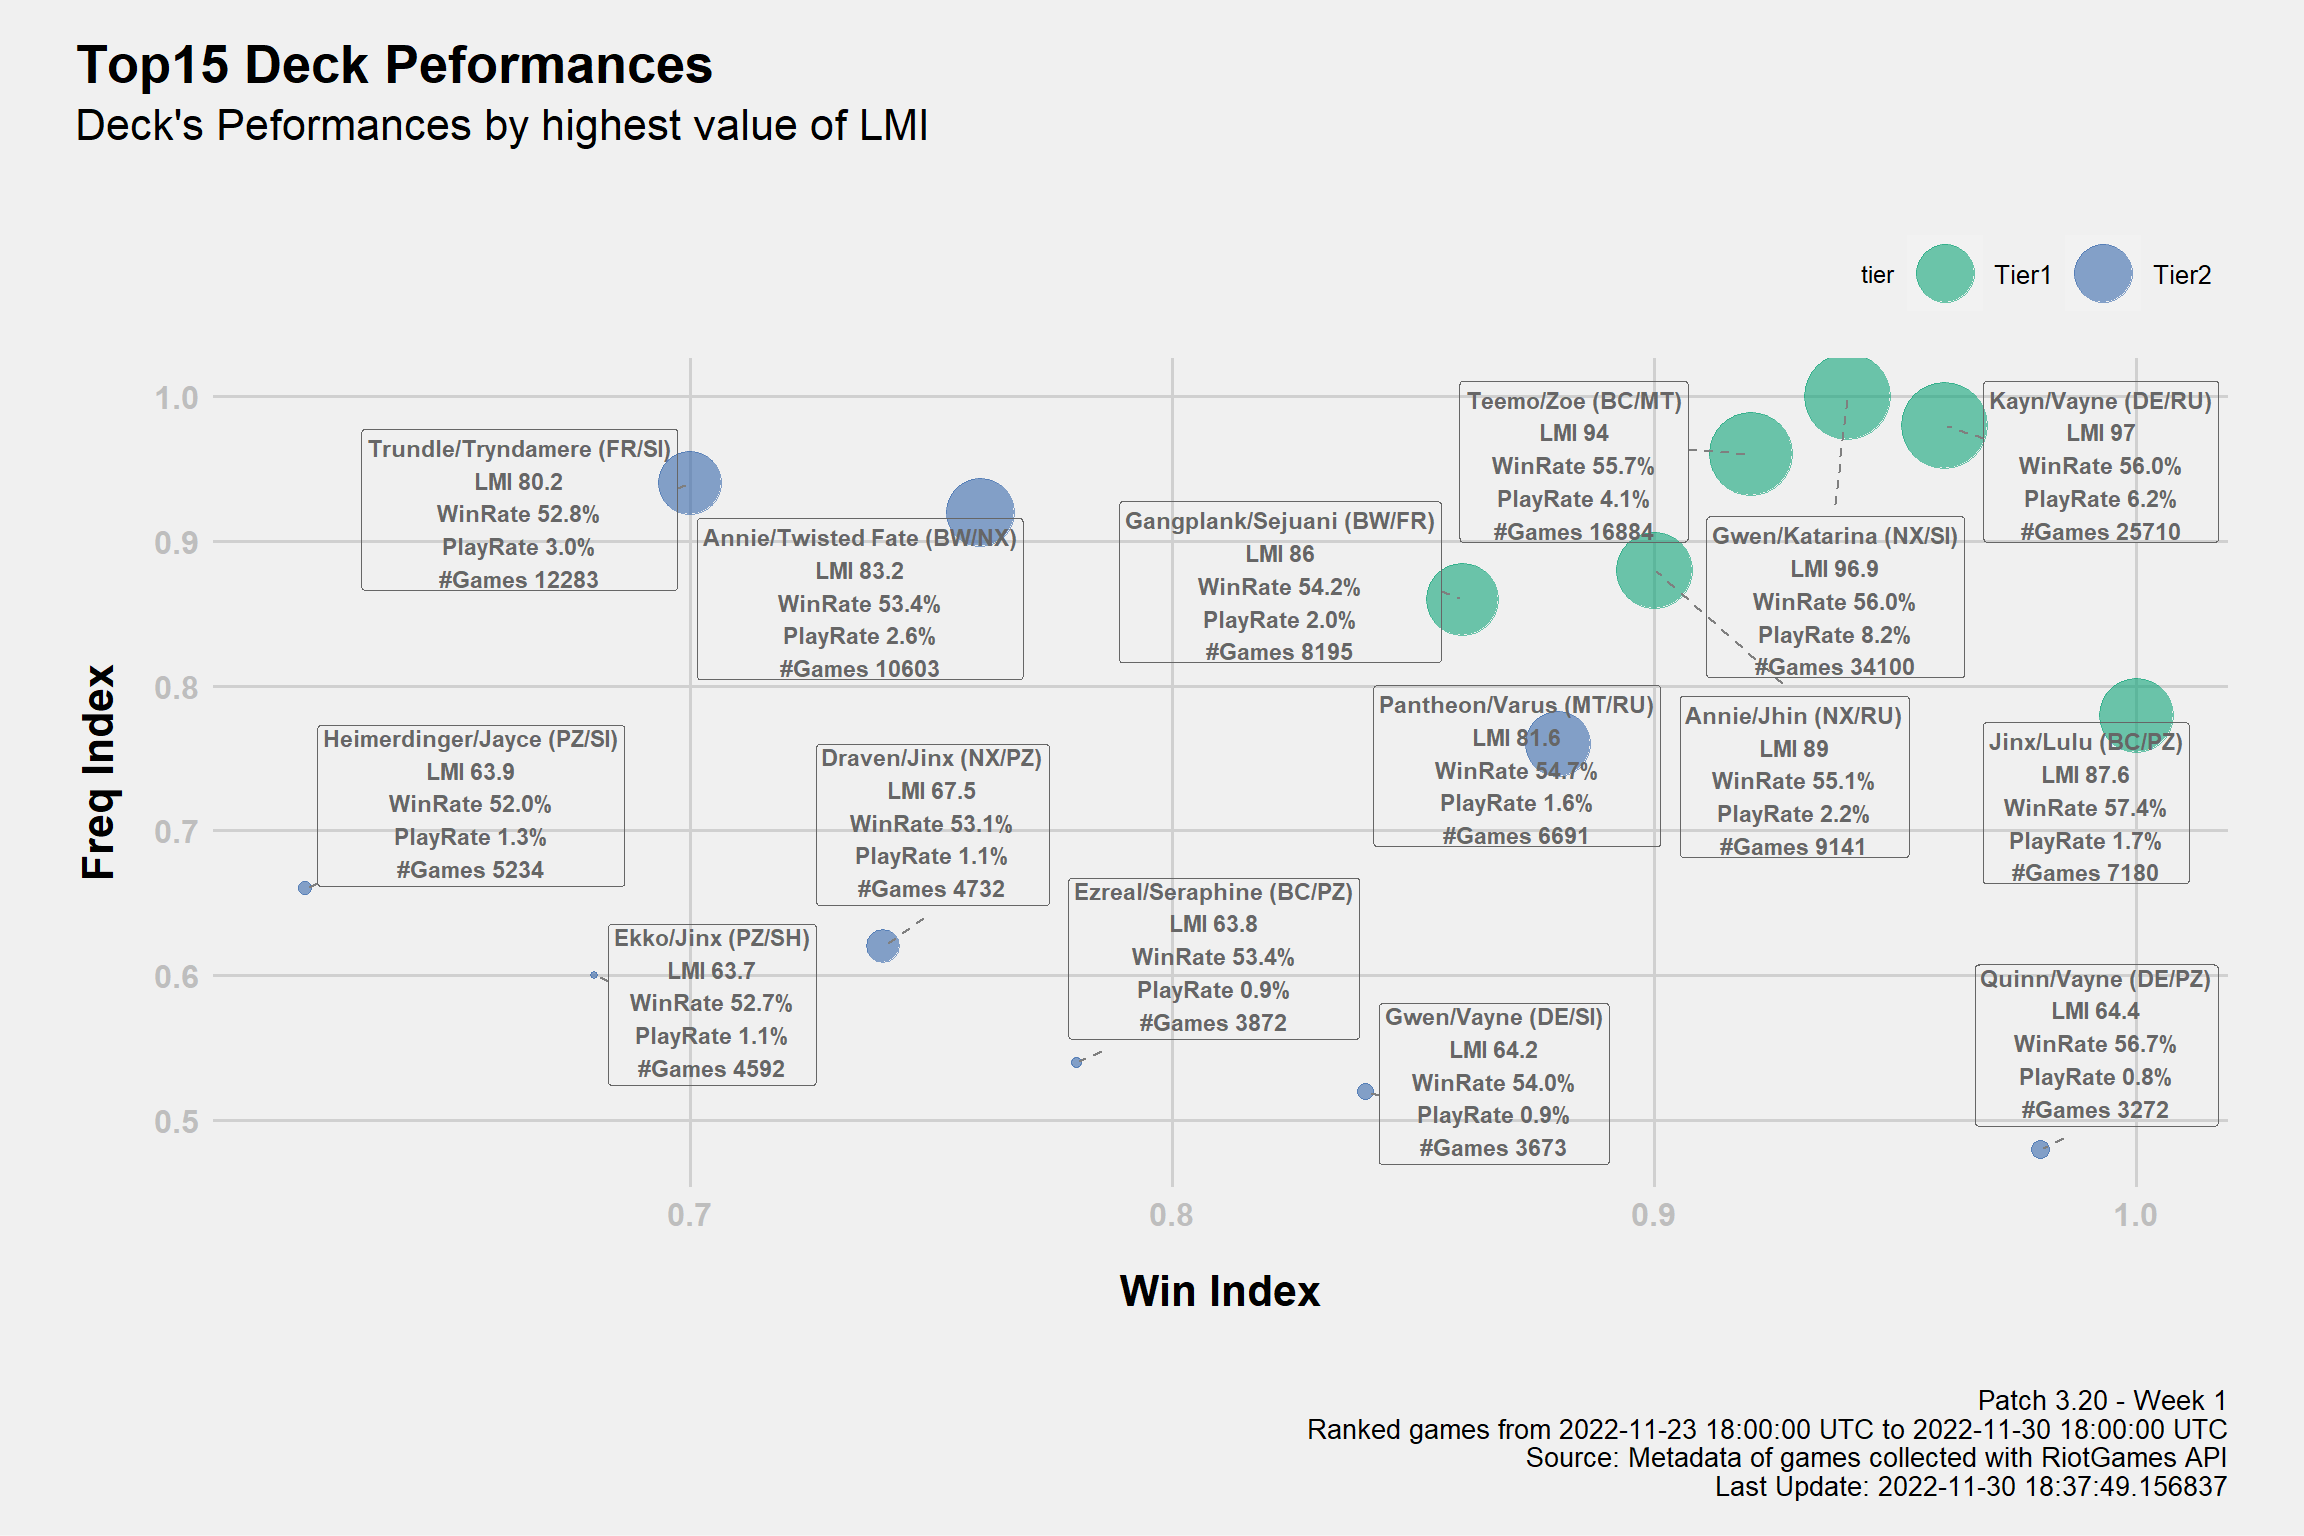
The LMI 2 3 is an Index I developed to measure the performance of decks in the metagame. For those who are familiar with basic statistical concept I wrote a document to explain the theory behind it: , it’s very similar to vicioussyndicate (vS) Meta Score from their data reaper report. The score of each deck is not just their “strength”, it takes in consideration both play rates and win rates that’s why I prefer to say it measure the “performance”. The values range from 0 to 100 and the higher the value, the higher is the performance.
Win Marathons Leaders
Top3 Players (or more in case of ties) from each server that had the highest amount of consecutive wins with the same archetype. The provided deckcode is the one played in the last win found.
| Top3 Biggest Win Streak by Server | |||
| Cumulative wins with the same Archetype | |||
| Player | Result | Archetype | Deck Code |
|---|---|---|---|
| Americas | |||
| Spartann | 17 | Maokai/Nautilus (BW/SI) | |
| King Weso | 16 | Gwen/Vayne (DE/SI) | |
| 暮冬煮雪 | 15 | Kayn/Vayne (DE/RU) | |
| Apac | |||
| Pandora | 18 | Swain/Twisted Fate (BW/NX) | |
| Professor X | 18 | Jinx/Lulu (BC/PZ) | |
| 챌린저의실력 | 16 | Gwen/Katarina (NX/SI) | |
| Europe | |||
| OSW Sir Donald | 19 | Teemo/Zoe (BC/MT) | |
| glossaryck | 15 | Championless (MT/PZ) | |
| PhlameHorizon | 15 | Quinn/Vayne (DE/PZ) | |
| Games from all Master are collected each hour adding up to the last 20 matches. Unlikely but possible to miss games in case of high frequency games. Metadata of games collected with RiotGames API | |||
Cards Presence (at Master)
Play Rate
Top 3 Play Rates by Region
Forgotten Cards
Cards that couldn’t find place even in a meme deck.
Not-Standard Archetype Names
Names and rules for the “non standard archetypes” which are not defined by Champion+Regions
| Archetype ~Fix | |
| Deck | Source |
|---|---|
| ASZ - Sivir Ionia | Akshan/Sivir (IO/SH) or Sivir/Zed or Akshan/Sivir/Zed |
| BandleTree | 3 copies of BandleTree |
| Camavoran Deserter | 2+ Legion Deserter and 2+ Viego |
| Dragons (DE/MT) | (DE/MT) Decks with *at least* Shyvana and ASol |
| Marauder | (NX/FR) Two to Three copies of Both Legion Marauder and Strength in Numbers |
| Mistwraith Allegiance | Three copies of both Mistwraith and Wraithcaller |
| Pack Your Catalogue (Regions) | Three copies of Go Hard and 2+ of Catalogue of Regrets |
| Pirates (BW/NX) | BW/NX deck with Miss Fortune and any of Twisted Fate, Gangplank |
| Plunder Pandemonium (Regions) | 2+ Powder Pandemonium and at least 32 Bilgewater Cards |
| RubinBait - <Champ> | Burn Deck using <Champ> to bait mulligan |
| Sentinel Control | PnZ/SI deck any combination of Elise/Jayce/Vi |
| Kindred Control | PnZ/SI deck any combination of Elise/Jayce/Vi AND Kindred |
| SunDisc | Mono Shurima with 1+ Sun Disc - without Rek'Sai |
| Tri-Beam (NX/PZ) | (NX/PZ) deck with at least 2 copies of Tri-Beam |
| Trundle Timelines (FR/PZ) | Trundle and Concurrent Timelines |
| Viktor - Shellfolk | Viktor + at least one of Curious Shellfolk/Mirror Mage + at least 2 Trinket Trade |
Legal bla bla
This content was created under Riot Games ‘Legal Jibber Jabber’ policy using assets owned by Riot Games. Riot Games does not endorse or sponsor this project.
HighDiamond are defined as “players who played against Master player in a Ranked games but are not Master themselves”↩︎