Data
Number of Players: 5173 Master
| Shard/Server | Americas, N = 1,9951 | Europe, N = 1,7141 | Sea, N = 1,4641 |
|---|---|---|---|
| Player Rank | |||
| Master | 1,995 (100%) | 1,714 (100%) | 1,464 (100%) |
|
1
n (%)
|
|||
Number of (Ranked) Master matches analysed 87365 or 174730 games.
Number of (Ranked) ~HighDiamond matches analysed 240719 or 481438 games.
| Patch 3.10 - Week 3 - by the Numbers1 | ||||
|---|---|---|---|---|
| Characteristic3 | Master2 | ~HighDiamond2 | ||
| N = 213,1604 | N = 87,8374 | N = 388,9084 | N = 241,5634 | |
| Status | ||||
| Ranked | 87,837 (41%) | 241,563 (62%) | ||
| Other | 63,723 (30%) | 72,995 (19%) | ||
| PathOfChampion | 40,592 (19%) | 56,456 (15%) | ||
| Friendly | 21,008 (9.9%) | 17,894 (4.6%) | ||
| Server | ||||
| americas | 84,307 (40%) | 34,250 (39%) | 131,579 (34%) | 79,046 (33%) |
| apac | 61,336 (29%) | 23,780 (27%) | 151,652 (39%) | 97,029 (40%) |
| europe | 67,517 (32%) | 29,807 (34%) | 105,677 (27%) | 65,488 (27%) |
|
1
Max datetime recovered: 2022-02-16 17:33:12 UTC from 2022-02-09 18:00:00 to 2022-02-16 18:00:00 UTC
2
EU Master 1715
NA Master 1993
APAC Master 1465
3
Metadata from Friendly Matches (that aren't Bo3) is not recoverable,
the value may not be perfect since I lack the starting time of the game. The amount of Games to still scrap is also an estimation based on the 'position' of the game
4
n(%) took from the number of matches. When the data is analysed the size is double since we account each different player
|
||||
Last Update: 2022-02-17 09:18
Seasonal Tournament Top32 Results
Before providing the usual description of last week high ranked games here are the results from the top32
Note: As not all decks has being played I can’t provide a complete coverage of the lineUps but 216/288 decks overall.
Games Results
| Top32 Results | ||||||
|---|---|---|---|---|---|---|
| Game results from the top32 players of the Magic Disadventures Seasonal Tournament | ||||||
| WonMatches | americas | apac | europe | |||
| Player | result | Player | result | Player | result | |
| 5 | NNT Elder Senior | やまと | SaltySimonSE | |||
| 4 | HDR Lazyguga | QuấtNoobs | o5wtf | |||
| 3 | FloppyMudkip | Mawile | Meliador0 | |||
| 3 | XxWhatAmIxX | Phoenix | schrewd | |||
| 2 | 4LW HDR | AG Gragassassin | KOVA alleyCaesar | |||
| 2 | FilthyGamerWeeb | Louis | mic check | |||
| 2 | Nano | sai | Owi | |||
| 2 | NNT IzziOwned | Torra | sidak123 | |||
| 1 | AL911AL | AG Glory | Barbirose | |||
| 1 | eolant | Bạn đang lạc lối | FBX Prièst | |||
| 1 | infinipatrons | earthntp | Liquid Alanzq | |||
| 1 | Led2000 | END Kienxun | MDS | |||
| 1 | Markled | Moontal | Pavelicii | |||
| 1 | Orb Meister | tarakoman | ShuKee | |||
| 1 | random7HS | TG Huysama | Sokoï | |||
| 1 | Seku | VK Overdose | TED Gerik | |||
| 0 | AK Tomaszamo | 억까하지말아주세요 | Araneïs | |||
| 0 | Damian1917 | All Creation | Arren | |||
| 0 | Drisoth | Alphaking | Boky | |||
| 0 | FilipeLC | bOzZiES | Broken Ball | |||
| 0 | FNX rodsmtg | J01 | freshlobster | |||
| 0 | GCerqueira | kuro | GenesisCCG | |||
| 0 | HDR BlackBoss | Merua jp | Ghosterdriver | |||
| 0 | JGar | OPM Hammerhead | Hash | |||
| 0 | MajiinBae | OPM Zombieman | JAN | |||
| 0 | NNT Maitri | Pls Dont Hush Me | Kuraschi | |||
| 0 | Officer Oxygen | PlumX | ragnarosich | |||
| 0 | ptash | RD 페타 | Rivage | |||
| 0 | squallywag | RGE Kinhts | timmiTTimmit | |||
| 0 | VolcaronaTango | Shimayuki03 | TombSimon | |||
| 0 | Zinc Elemental | Sunekichi | Vladestiny | |||
| 0 | Zwolfe | VK 영처리 | Żółw Lamparci | |||
| Metadata of games collected with RiotGames API | ||||||
LineUps
Top32 Players' Deckcodes
Magic Disadventures Playoff - Top32 LineUps
As not all decks has being played I can't provide a complete coverage of the lineUps but 216/288 decks overall. Source: Metadata of games collected with RiotGames API
Regions
Play Rate
Plot
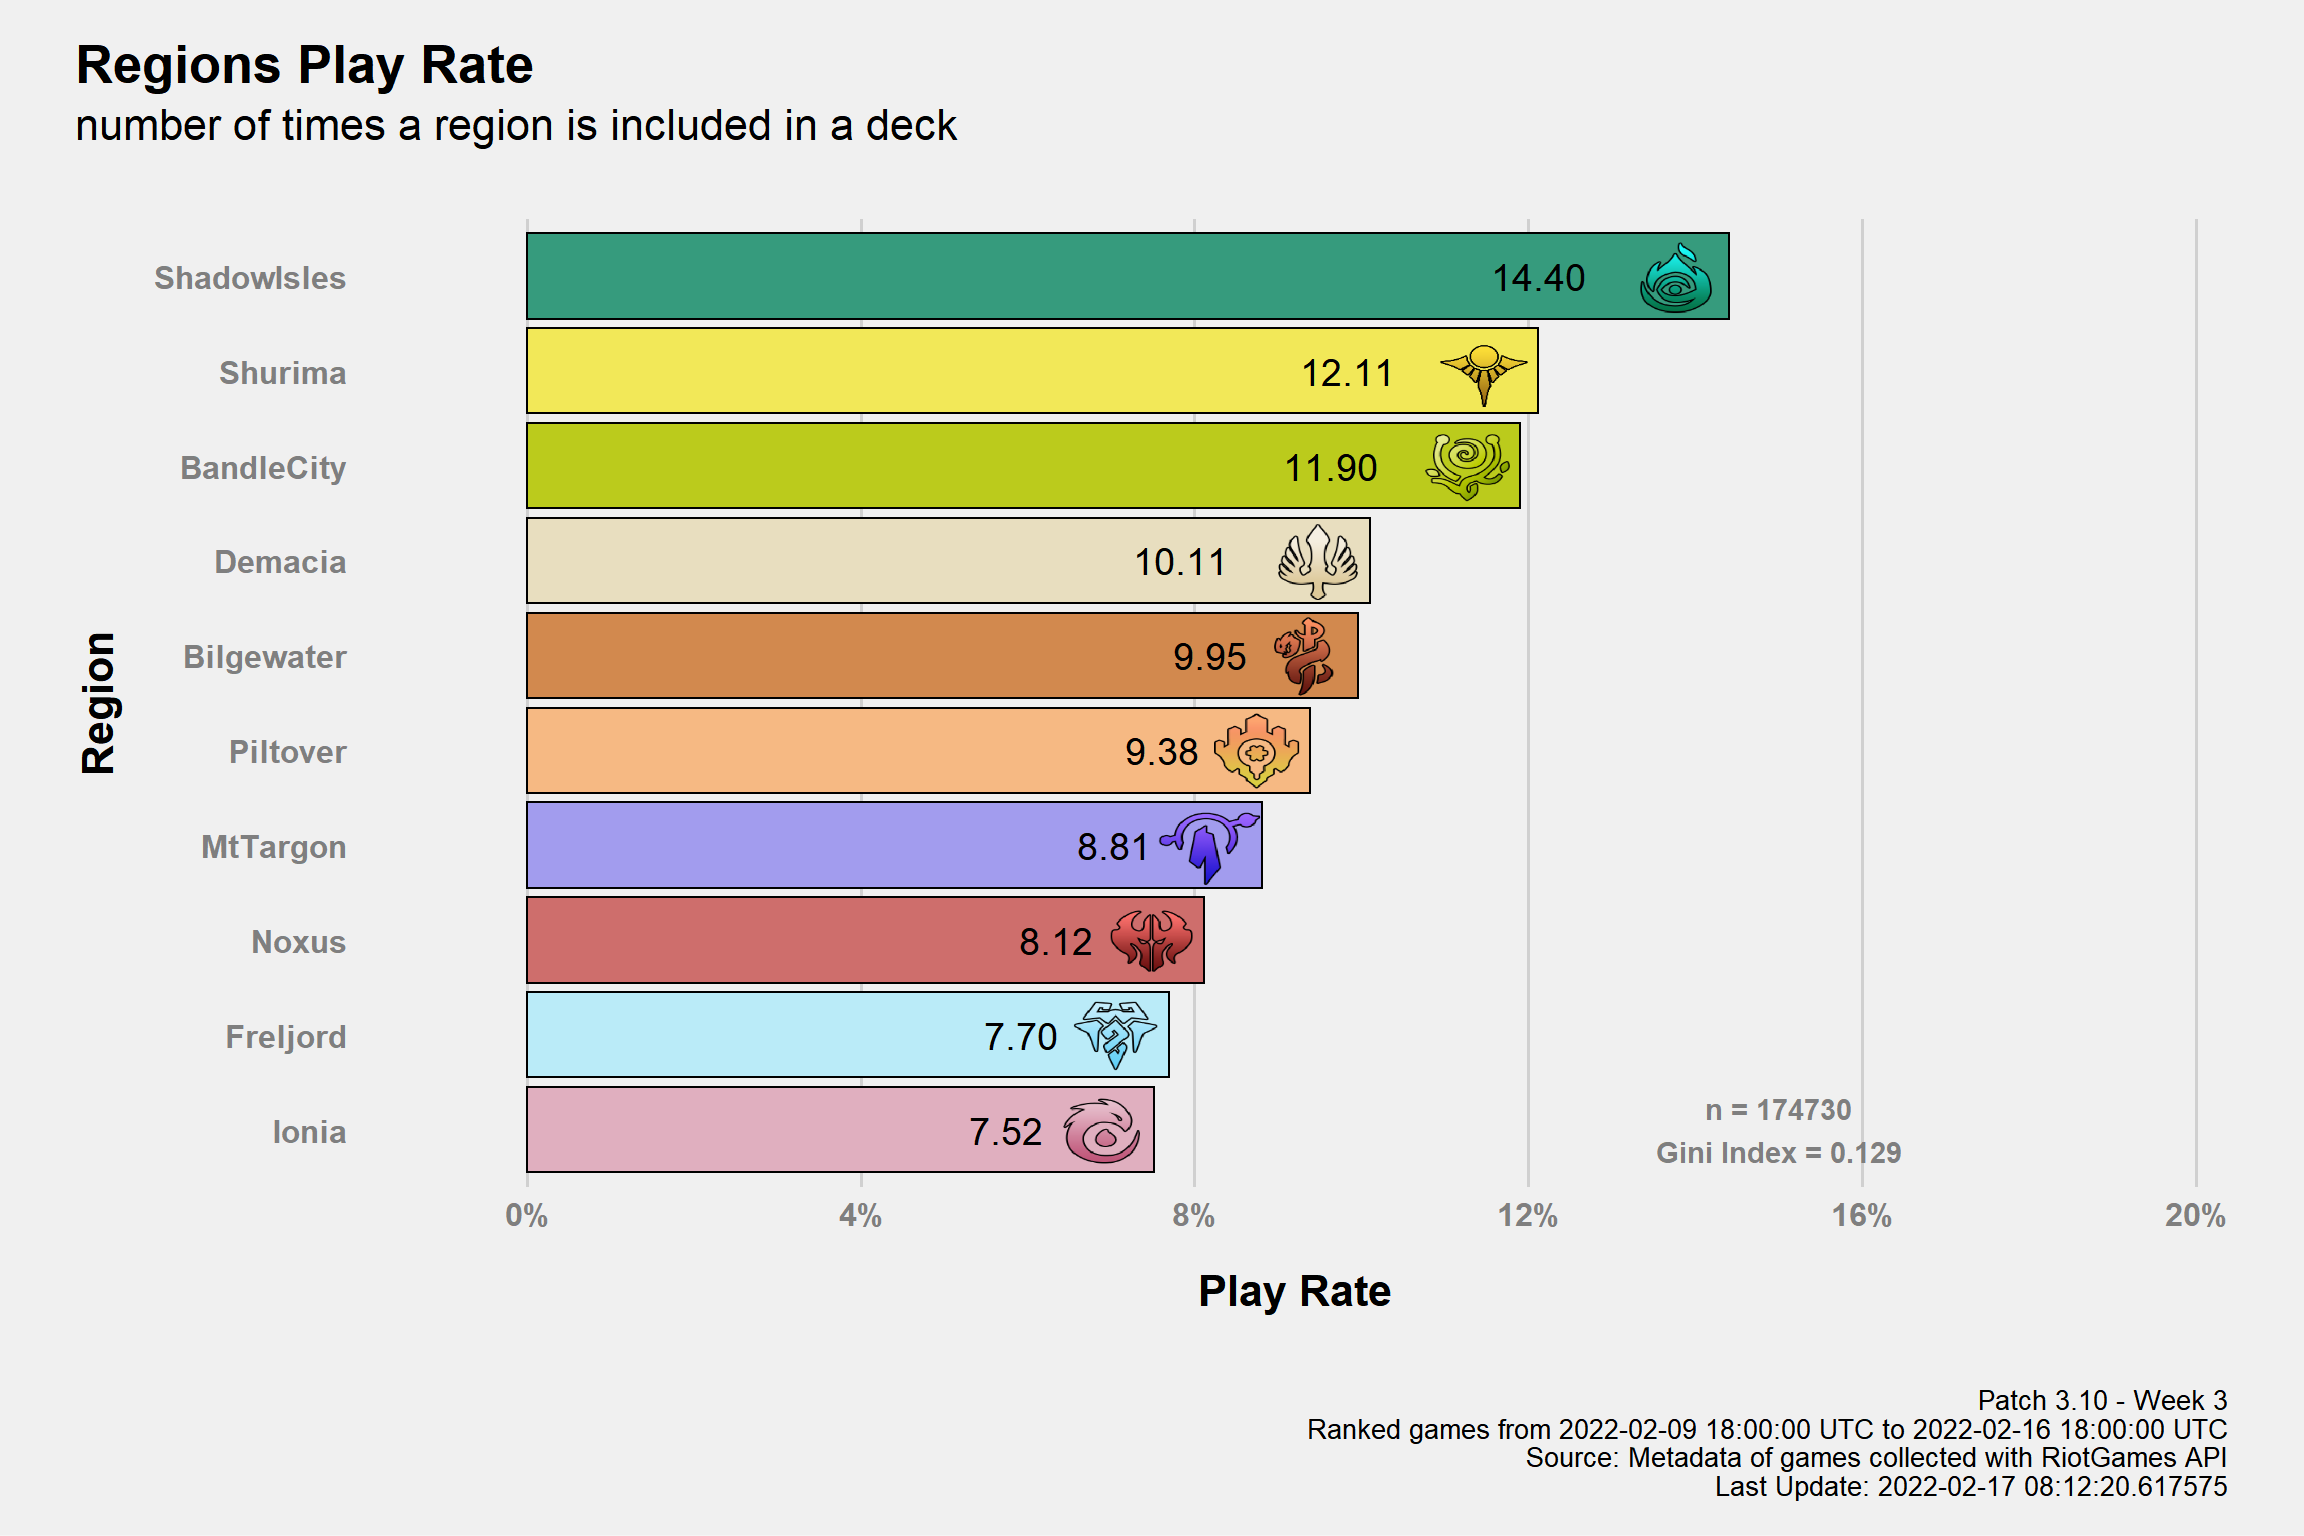
The Gini Index is a measure of heterogeneity so, in this case and in simpler terms, how much the play rates are similar. The Index goes (when normalized like here) \(in\) \[0,1\] and it’s equal to 1 when there’s a single value with 100% play rate or 0 when all play rates are equal. Of course a Gini Index of 1 needs to be avoided but it’s not like the aim should be 0. As said, it’s just to add some additional tools.
Table
| Region Play Rate | ||||
|---|---|---|---|---|
| Relative Frequencies by Inclusion Rate of a Region | ||||
| Region | Freq | Shard | ||
| America | Apac | Europe | ||
| ShadowIsles | 14.40% | 14.52% | 15.38% | 13.47% |
| Shurima | 12.11% | 12.03% | 12.49% | 11.91% |
| BandleCity | 11.90% | 11.01% | 11.85% | 12.97% |
| Demacia | 10.11% | 10.72% | 9.21% | 10.13% |
| Bilgewater | 9.95% | 10.46% | 9.81% | 9.49% |
| Piltover | 9.38% | 9.48% | 8.61% | 9.89% |
| MtTargon | 8.81% | 8.93% | 9.07% | 8.46% |
| Noxus | 8.12% | 8.11% | 6.84% | 9.16% |
| Freljord | 7.70% | 7.25% | 8.51% | 7.55% |
| Ionia | 7.52% | 7.49% | 8.24% | 6.97% |
| Patch 3.10 - Week 3 Ranked games from 2022-02-09 18:00:00 UTC to 2022-02-16 18:00:00 UTC Source: Metadata of games collected with RiotGames API Last Update: 2022-02-17 08:12:20.617575 | ||||
Play Rate by number of Cards
Plot
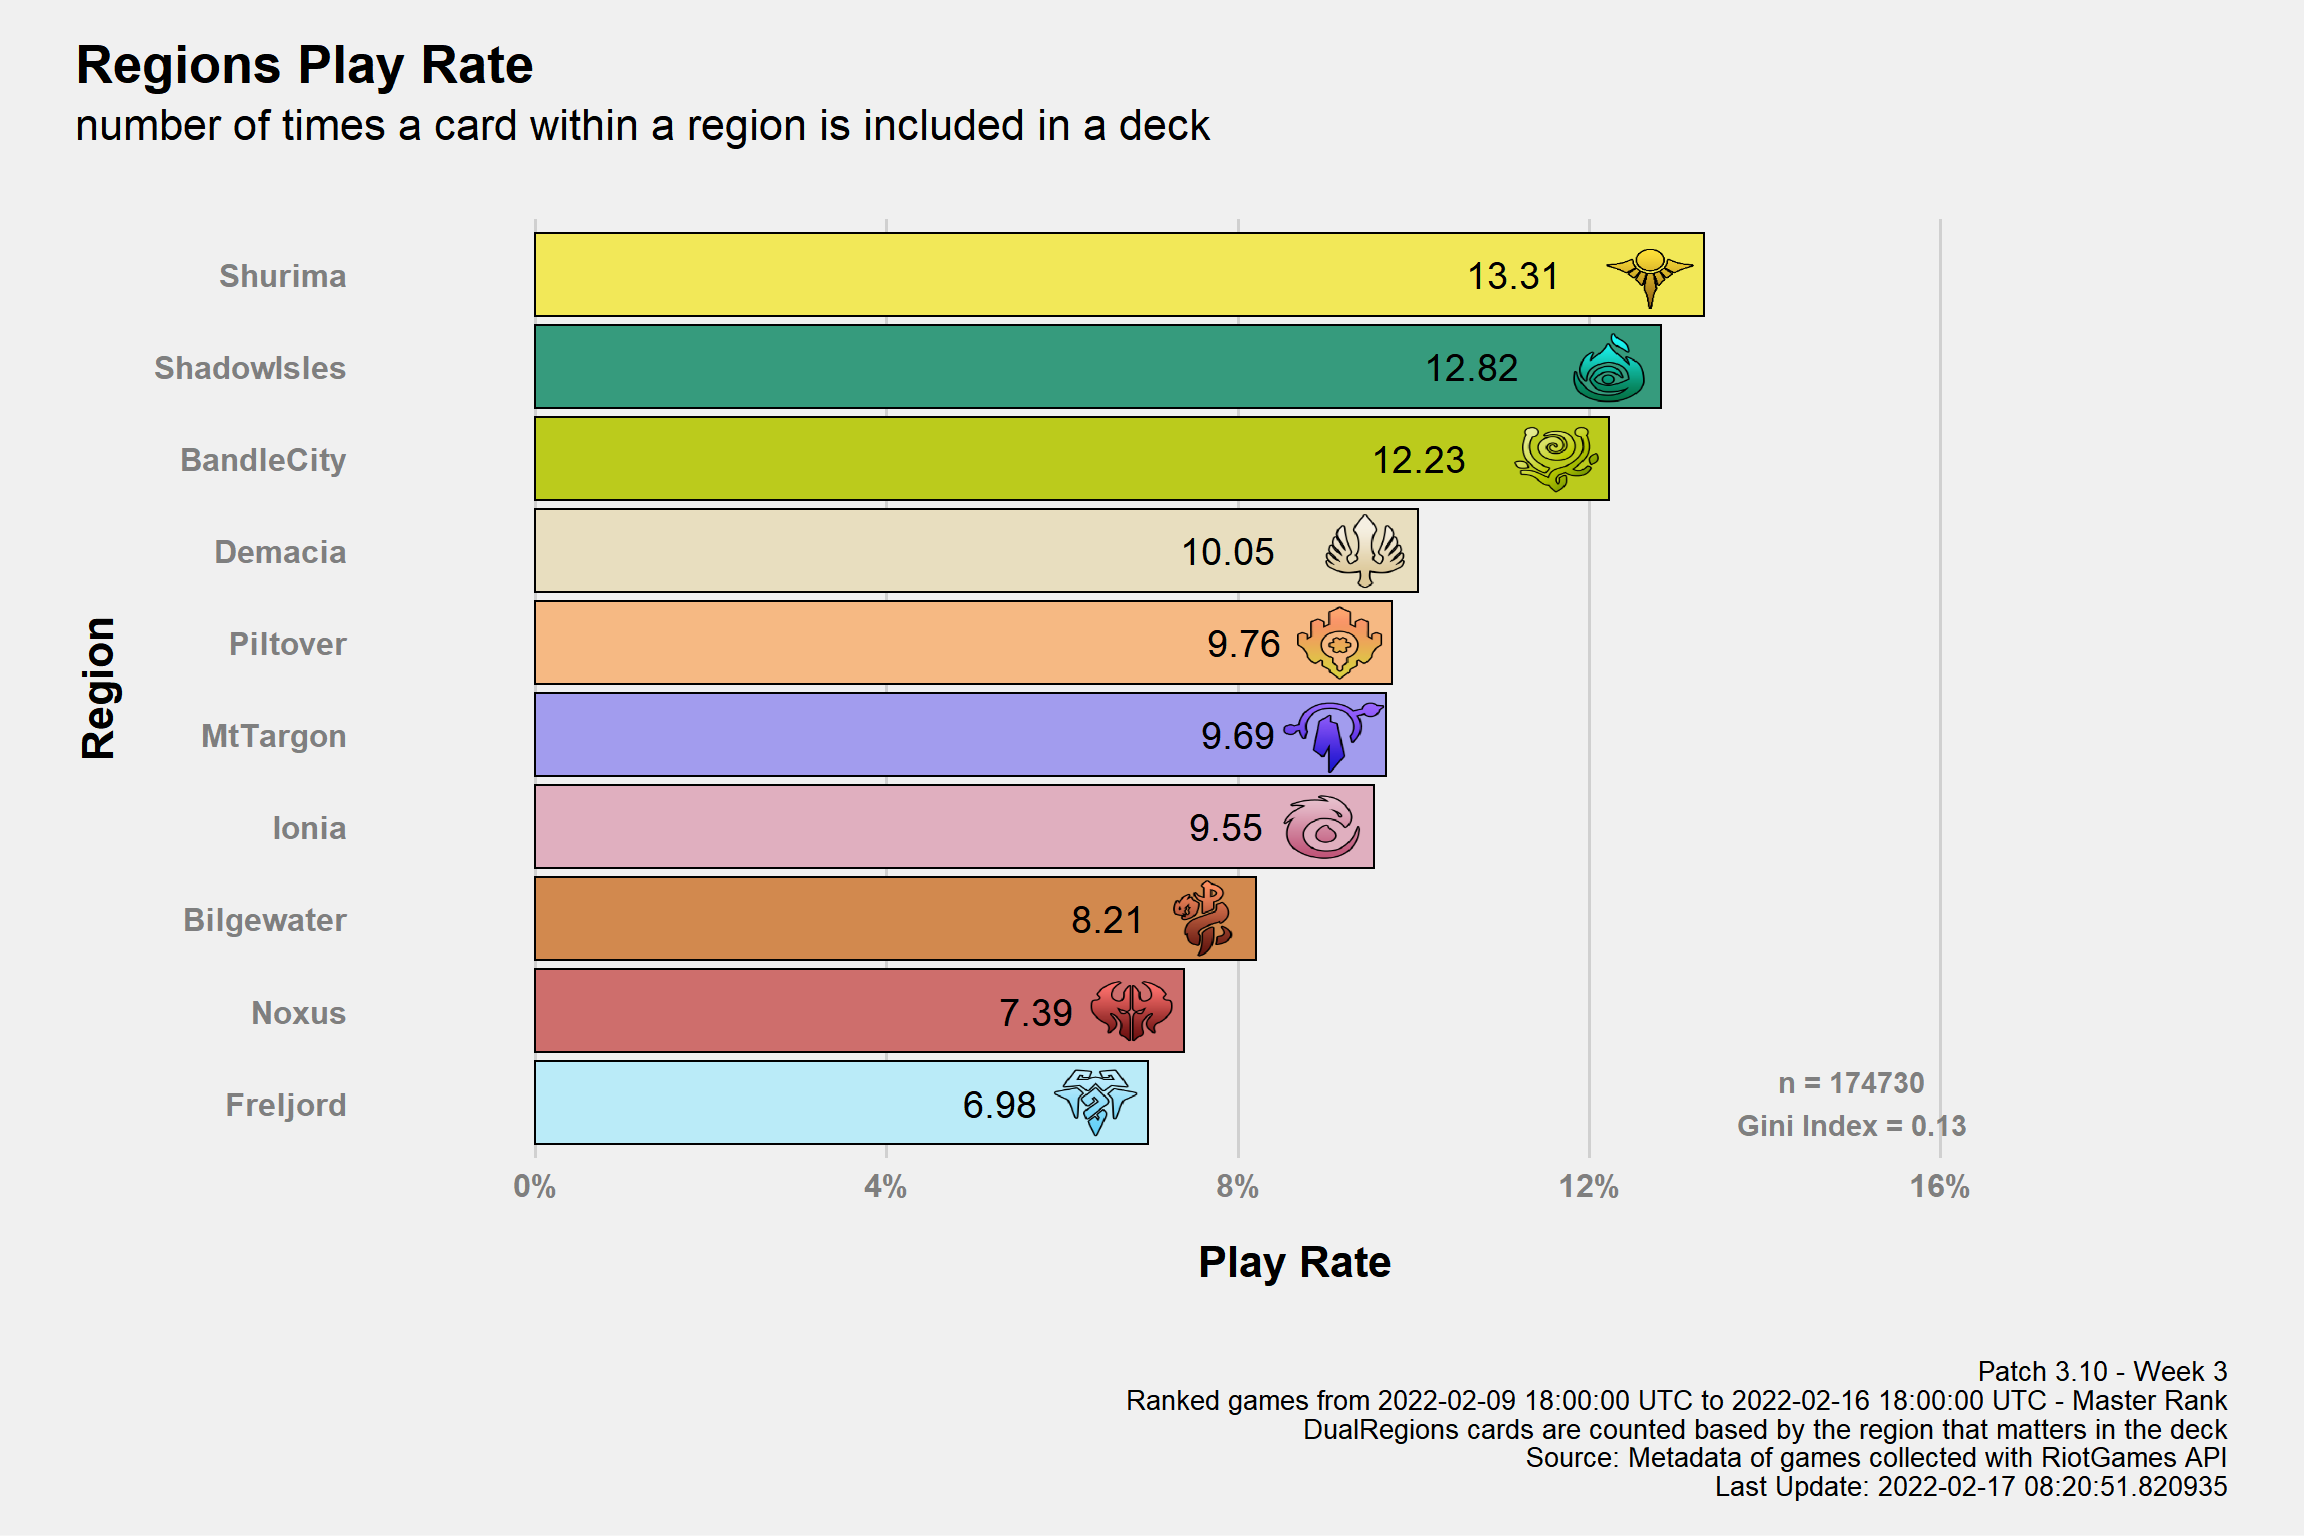
Table
| Region Play Rate | ||||
|---|---|---|---|---|
| Relative Frequencies by number of times a Card within a Region is included in a Deck | ||||
| Region | Freq | Shard | ||
| America | Apac | Europe | ||
| Shurima | 13.31% | 13.46% | 13.55% | 12.94% |
| ShadowIsles | 12.82% | 13.11% | 13.16% | 12.22% |
| BandleCity | 12.23% | 11.29% | 12.16% | 13.36% |
| Demacia | 10.05% | 10.66% | 9.24% | 10.01% |
| Piltover | 9.76% | 9.85% | 8.87% | 10.38% |
| MtTargon | 9.69% | 9.85% | 9.67% | 9.52% |
| Ionia | 9.55% | 9.42% | 10.62% | 8.85% |
| Bilgewater | 8.21% | 8.32% | 8.49% | 7.87% |
| Noxus | 7.39% | 7.45% | 6.31% | 8.20% |
| Freljord | 6.98% | 6.59% | 7.93% | 6.66% |
| Patch 3.10 - Week 3 Ranked games from 2022-02-09 18:00:00 UTC to 2022-02-16 18:00:00 UTC Source: Metadata of games collected with RiotGames API Last Update: 2022-02-17 08:12:20.617575 | ||||
Champions Combinations
Play Rates
Plot
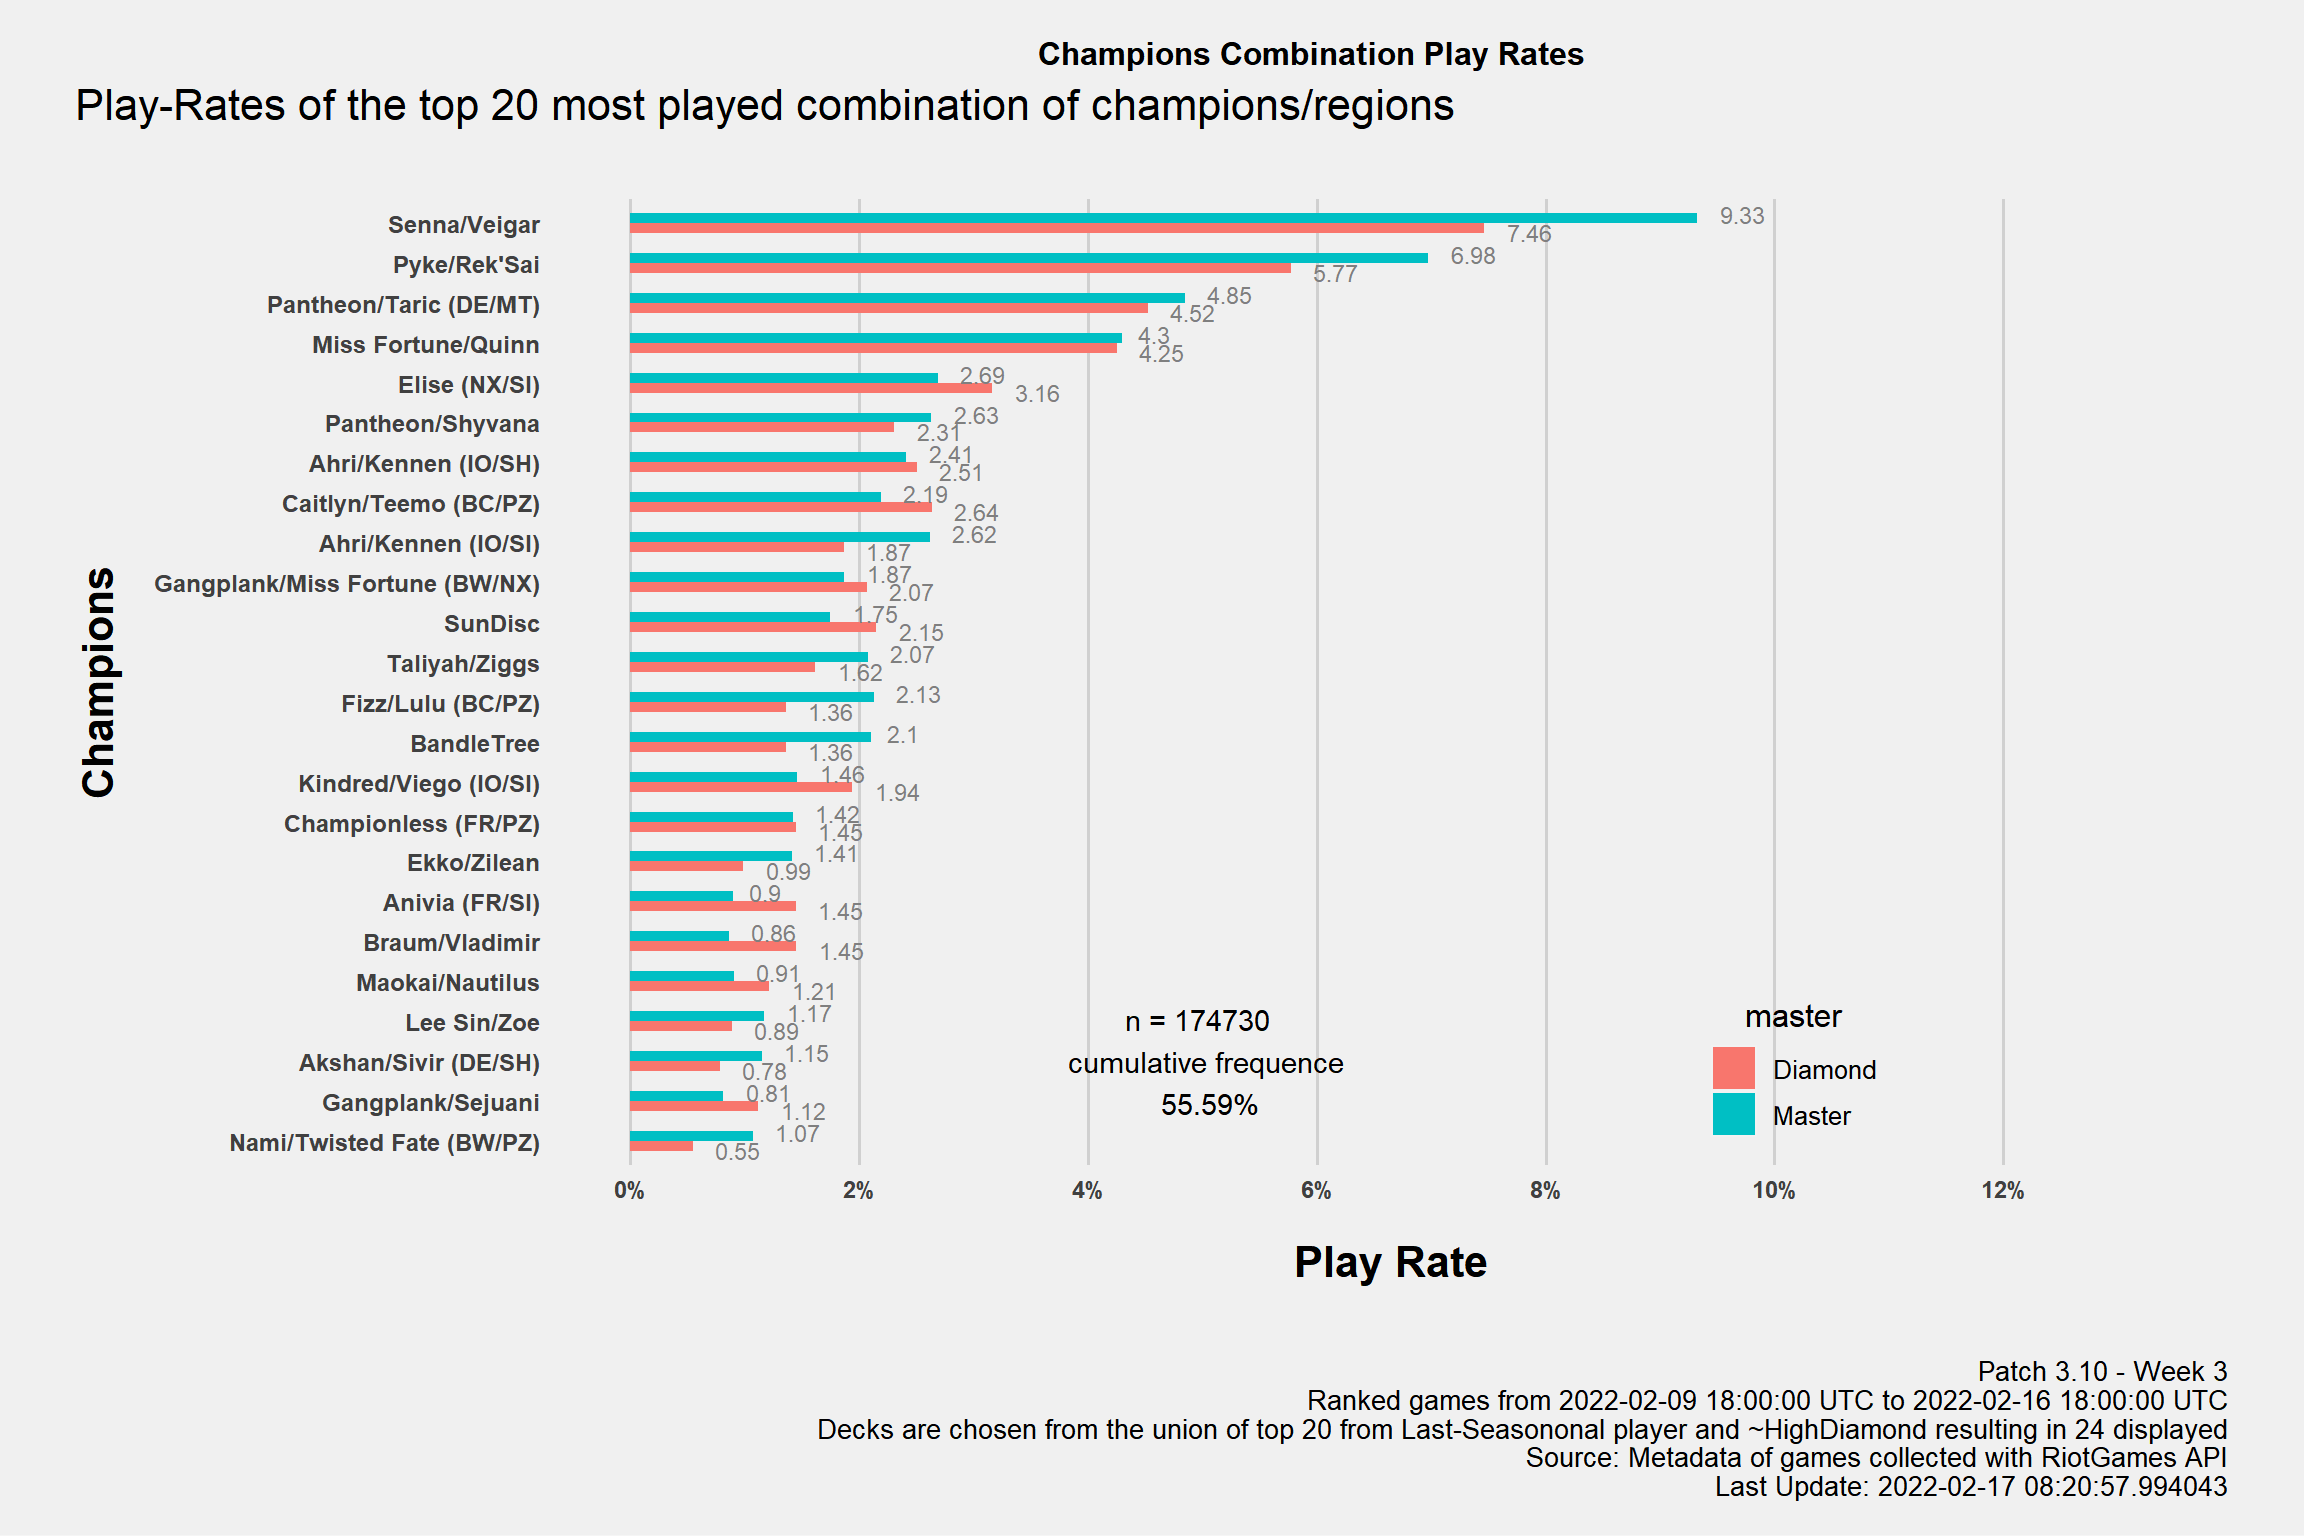
from Master
from ~HighDiamond
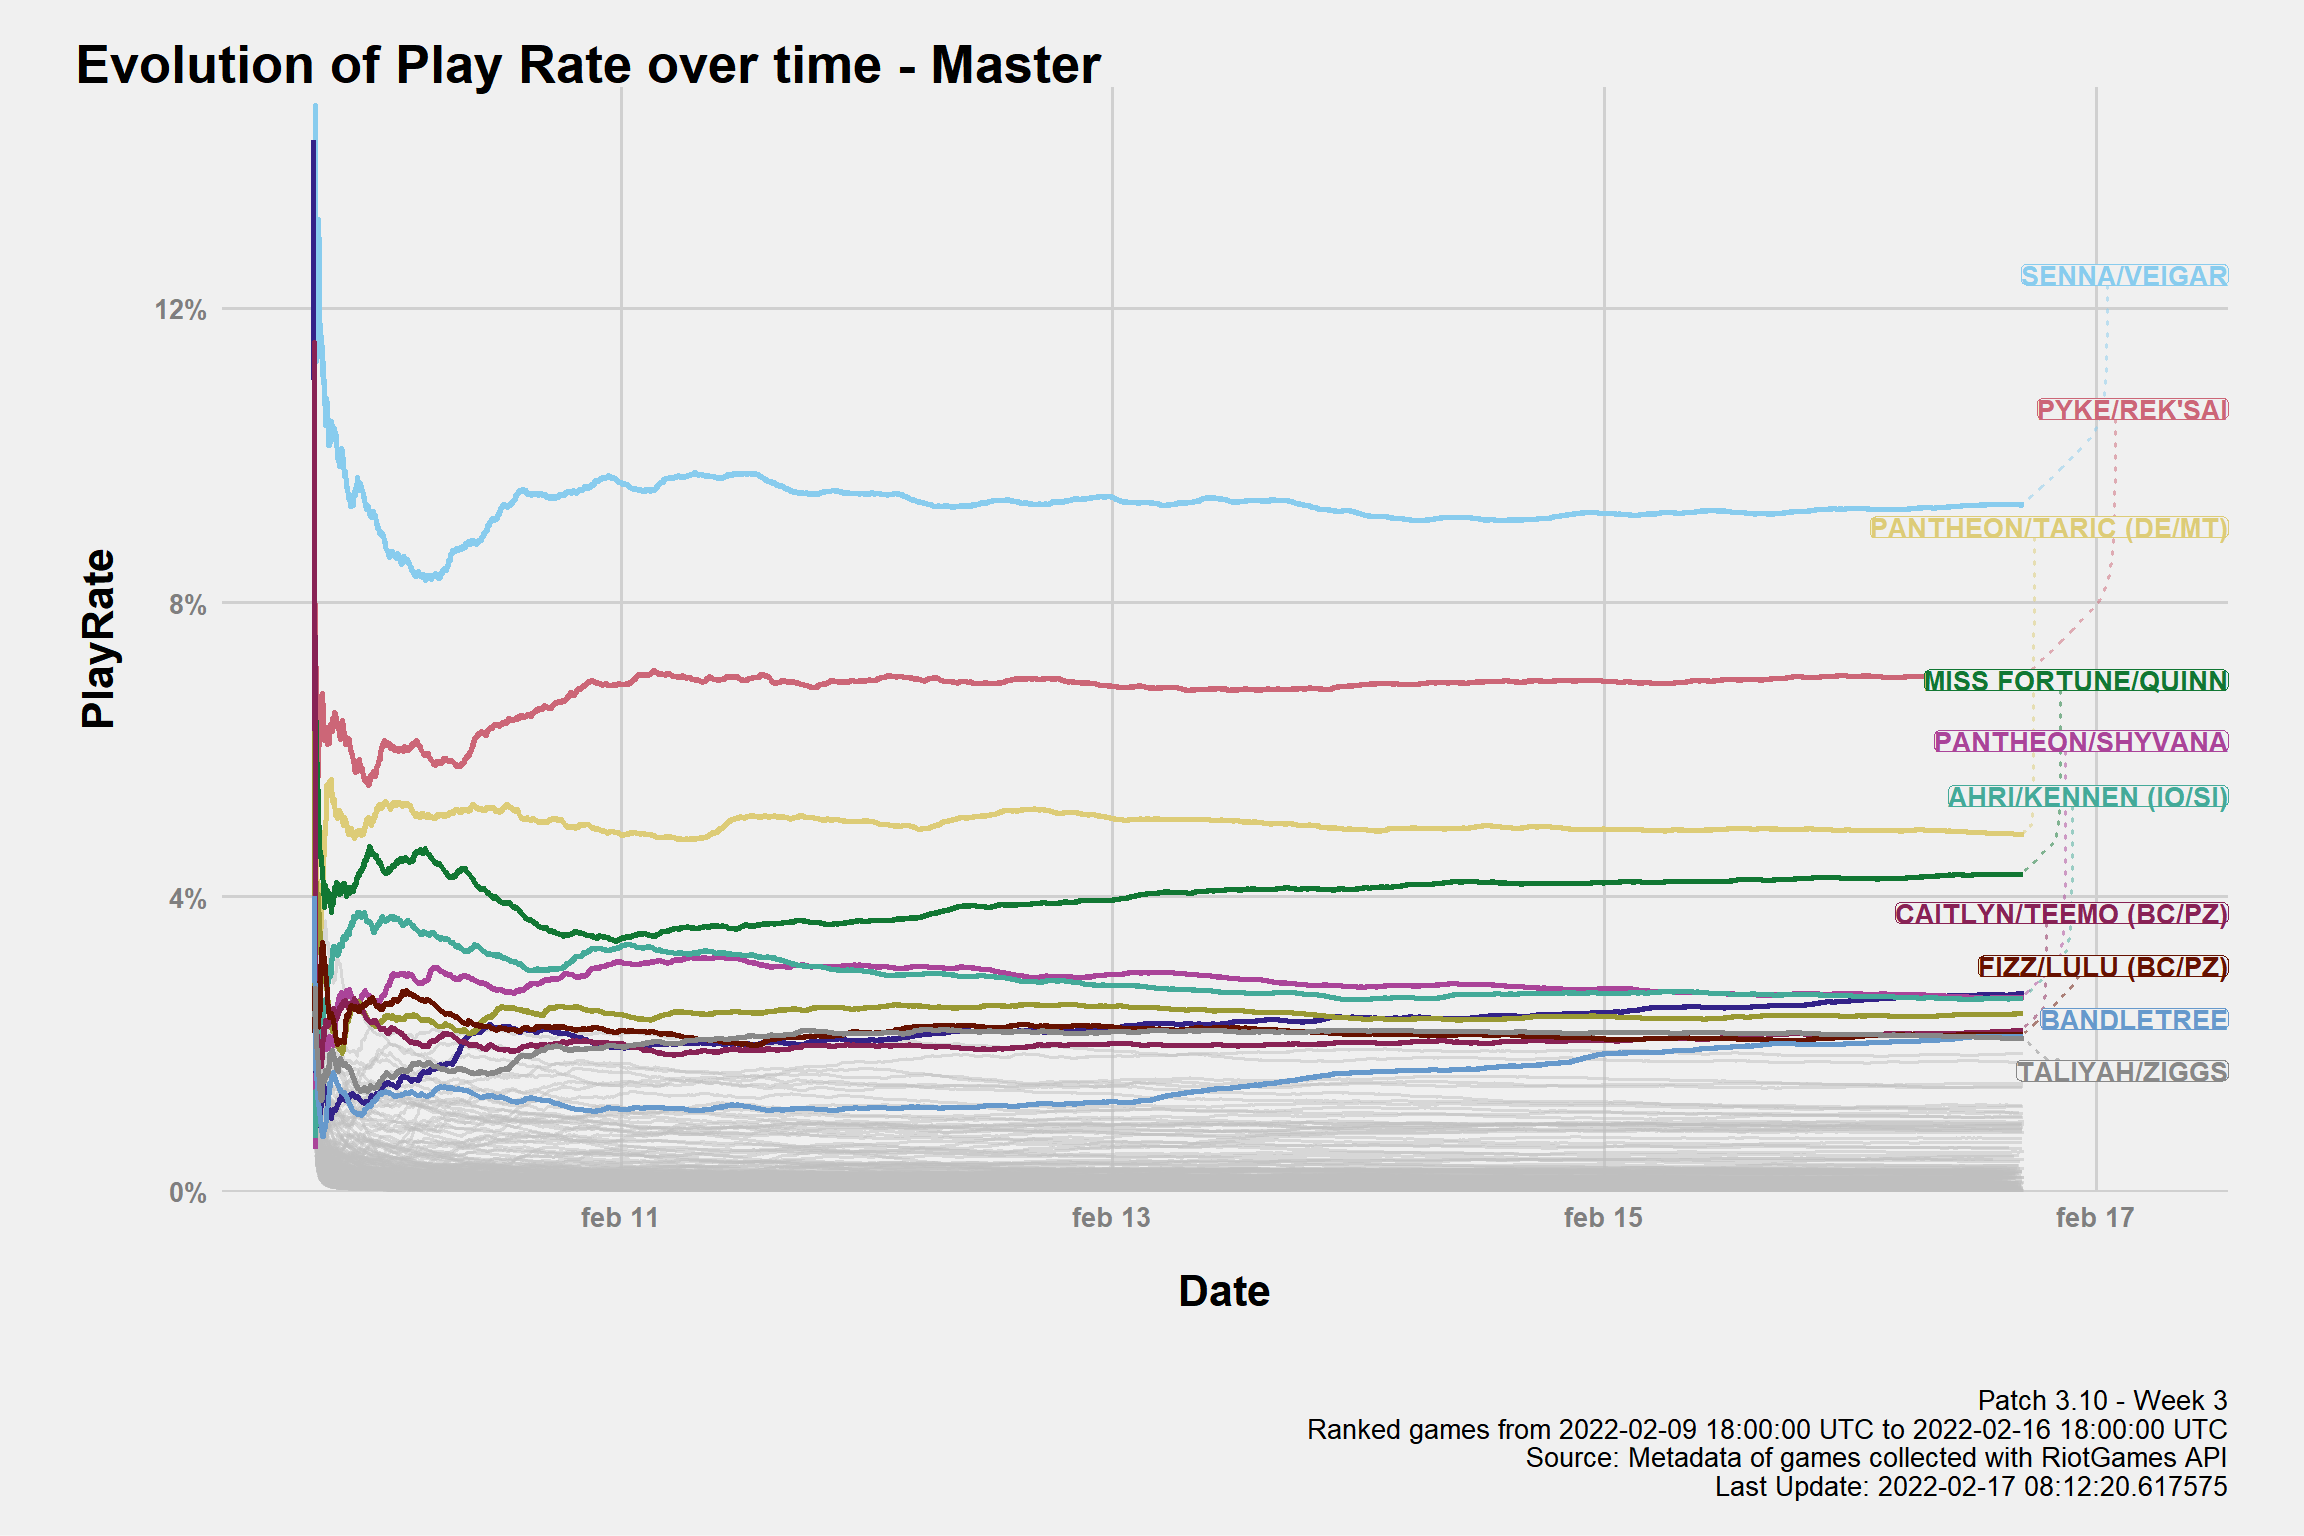
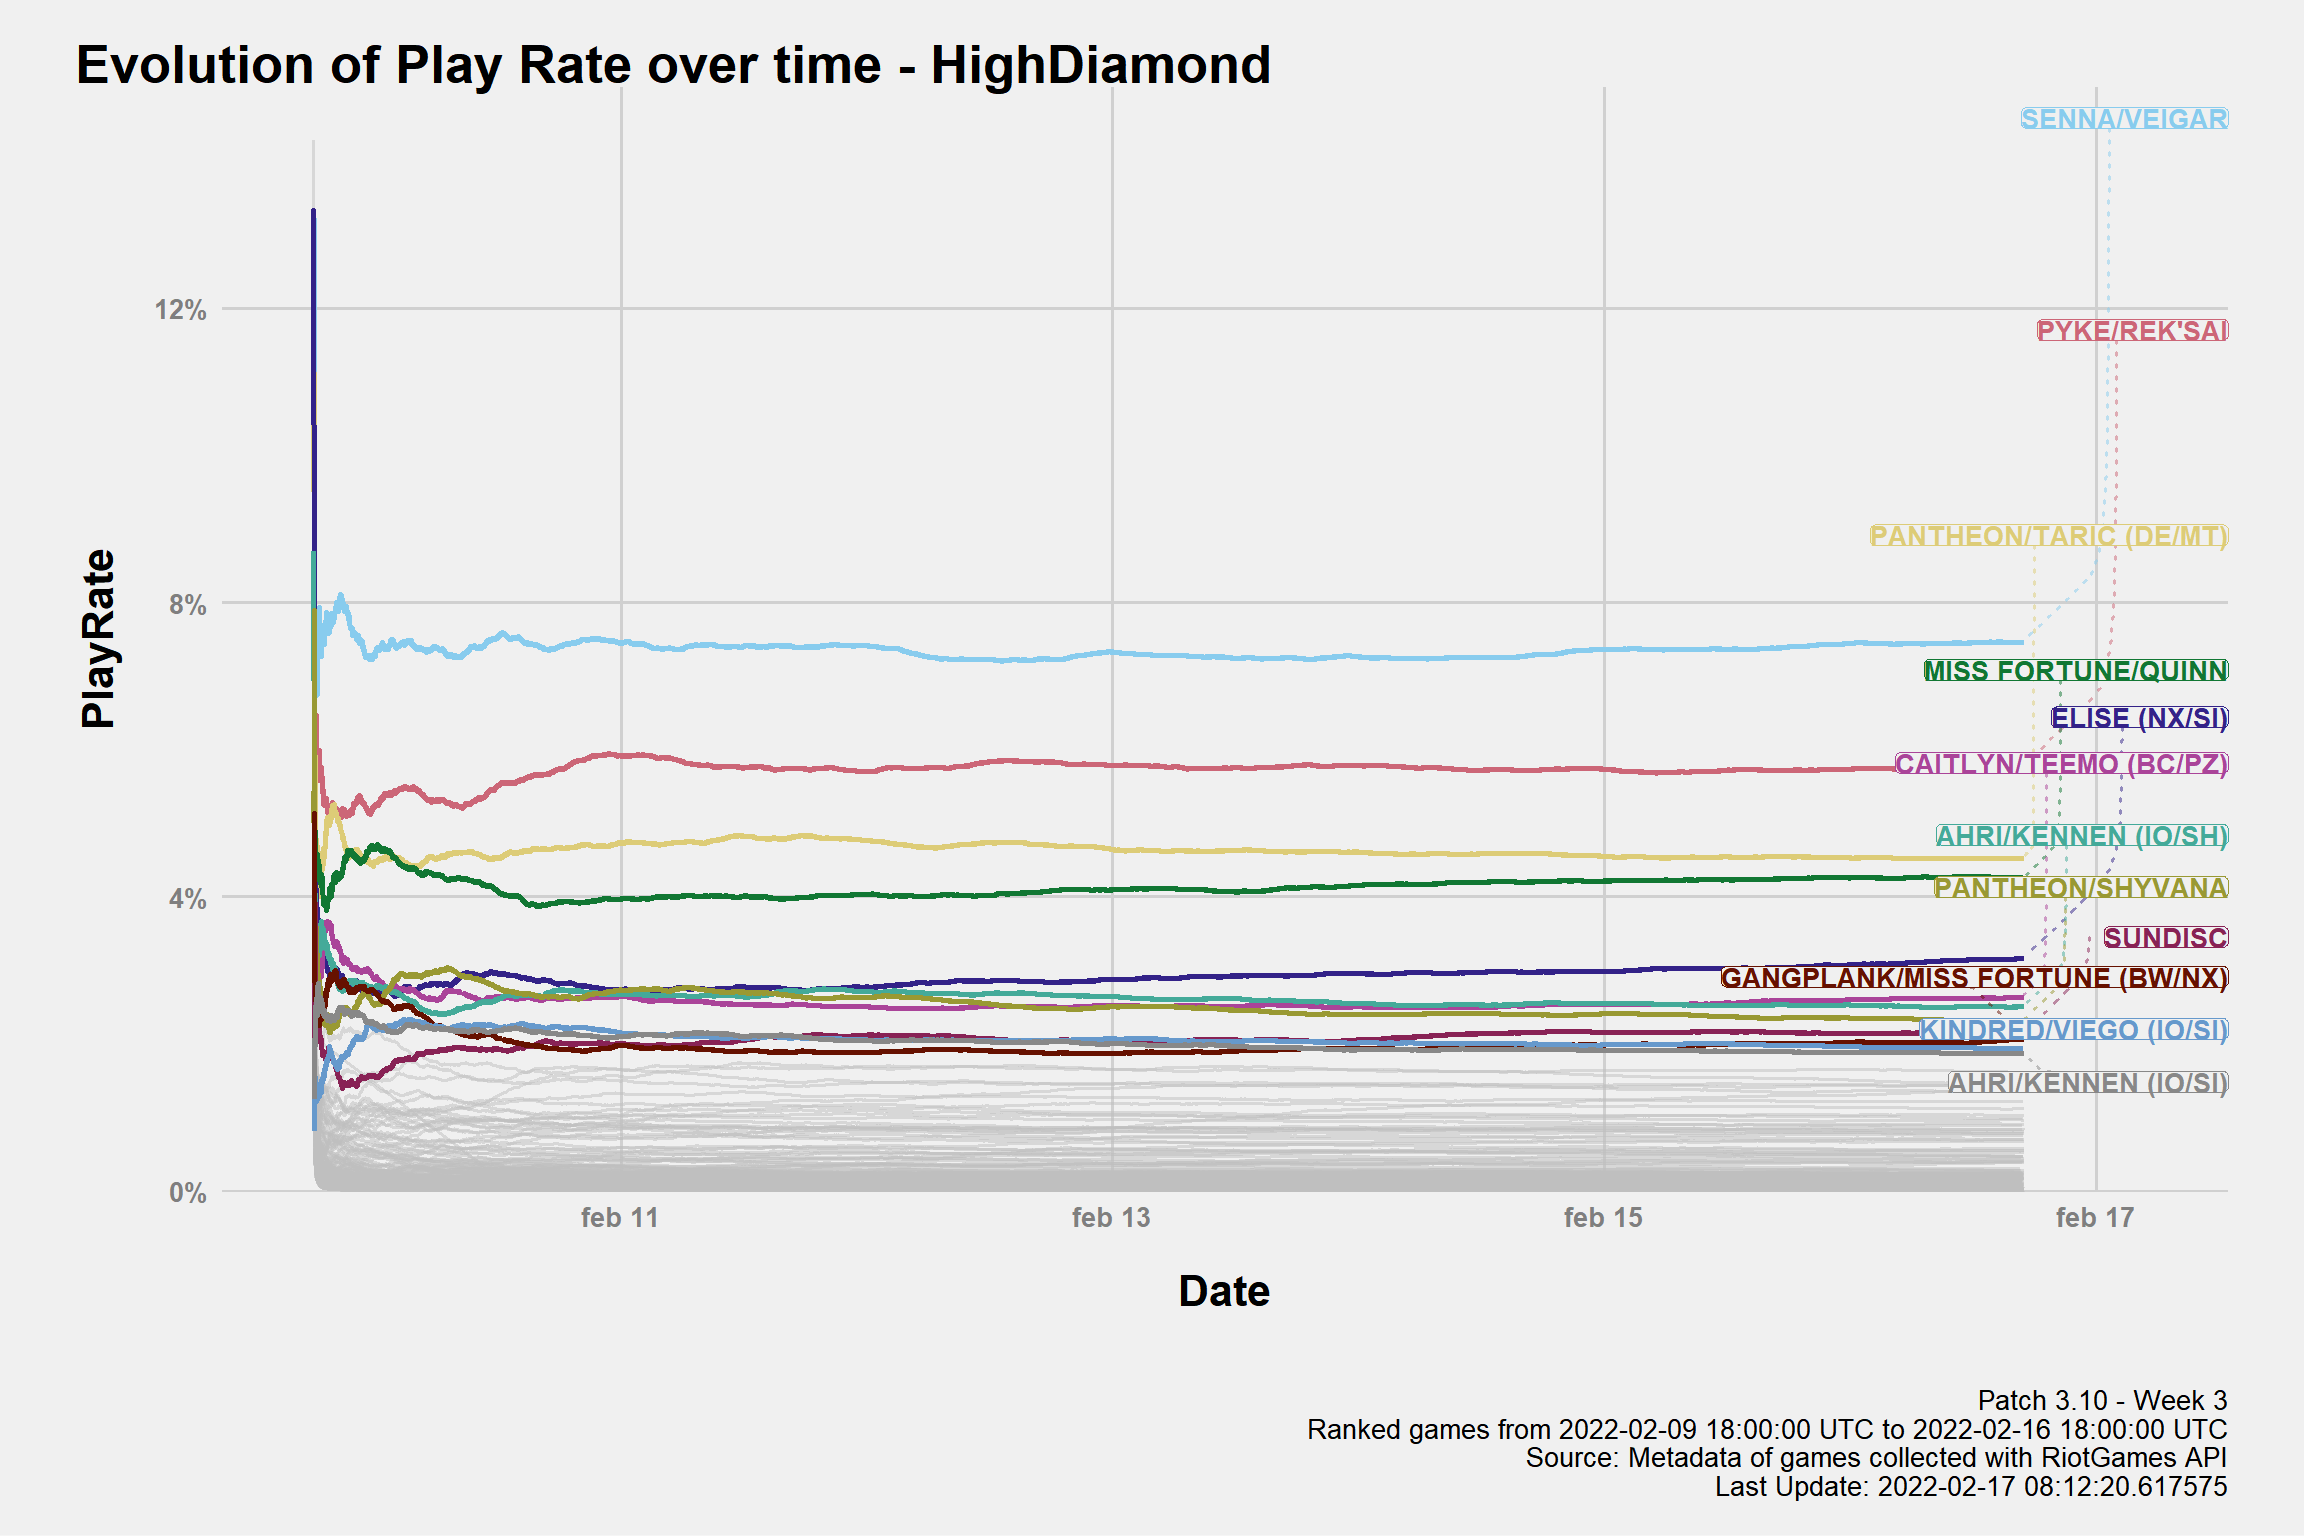
Day by Day
Highlighting the play-rates of most played1 decks over time.
Master
HighDiamond
Win Rates
Meta Decks
Win rates of the most played combination of champions. Play Rate \(\geq 1\%\) in at least one of the servers.
Underdog
Top Win rates of the top10 best performing least played combination of champions. Play rate \(\in [0.1%,1%)\) 2
Match Ups
Regarding MU, this is not the most accurate estimation you can get from my data. If you want a better picture of the current meta it would be better to look at the dedicated MU-page where I use all “Ranked” games with the current sets of buffs and nerfs. While one may object I don’t account for optimizations and differences in skills acquired during the weeks, the overall number of games / sample size makes them a better source of information. So, in case, please refer to the MU - page for a better “meta-investigation”.
Match-up Grid
The win rates on the grid are among the 10 most played champion combination.
The upper value is from all the Masters players, the bottom one only from ~HighDiamond.
MU with less than 30 games are not included.
| Senna/Veigar | Pyke/Rek'Sai | Pantheon/Taric (DE/MT) | Miss Fortune/Quinn | Elise (NX/SI) | Pantheon/Shyvana | Ahri/Kennen (IO/SI) | Ahri/Kennen (IO/SH) | Caitlyn/Teemo (BC/PZ) | Fizz/Lulu (BC/PZ) | |
|---|---|---|---|---|---|---|---|---|---|---|
| Senna/Veigar | NA
|
43.3%
44.3% |
39.7%
39.3% |
50.4%
49.8% |
66.6%
64.8% |
42.4%
42.3% |
54.1%
58.0% |
51.6%
52.4% |
50.4%
50.1% |
55.6%
57.4% |
| Pyke/Rek'Sai | 56.7%
55.7% |
NA
|
53.4%
52.2% |
50.4%
49.9% |
45.9%
39.6% |
61.3%
58.0% |
39.0%
42.6% |
34.5%
37.9% |
68.4%
68.9% |
42.9%
36.7% |
| Pantheon/Taric (DE/MT) | 60.3%
60.7% |
46.6%
47.8% |
NA
|
61.7%
61.8% |
35.3%
34.0% |
43.4%
44.1% |
39.1%
45.0% |
35.8%
36.1% |
69.7%
69.9% |
38.3%
39.1% |
| Miss Fortune/Quinn | 49.6%
50.2% |
49.6%
50.1% |
38.3%
38.2% |
NA
|
67.1%
61.1% |
40.4%
37.8% |
65.5%
64.9% |
57.8%
60.9% |
77.6%
71.3% |
45.6%
52.4% |
| Elise (NX/SI) | 33.4%
35.2% |
54.1%
60.4% |
64.7%
66.0% |
32.9%
38.9% |
NA
|
70.3%
68.7% |
56.5%
64.8% |
67.6%
70.6% |
60.9%
60.9% |
20.0%
26.8% |
| Pantheon/Shyvana | 57.6%
57.7% |
38.7%
42.0% |
56.6%
55.9% |
59.6%
62.2% |
29.7%
31.3% |
NA
|
48.9%
54.1% |
33.9%
33.0% |
67.4%
67.6% |
41.7%
44.7% |
| Ahri/Kennen (IO/SI) | 45.9%
42.0% |
61.0%
57.4% |
60.9%
55.0% |
34.5%
35.1% |
43.5%
35.2% |
51.1%
45.9% |
NA
|
58.3%
55.8% |
60.2%
58.3% |
59.4%
54.0% |
| Ahri/Kennen (IO/SH) | 48.4%
47.6% |
65.5%
62.1% |
64.2%
63.9% |
42.2%
39.1% |
32.4%
29.4% |
66.1%
67.0% |
41.7%
44.2% |
NA
|
58.3%
55.9% |
44.0%
49.0% |
| Caitlyn/Teemo (BC/PZ) | 49.0%
49.9% |
31.6%
31.1% |
30.3%
30.1% |
22.4%
28.7% |
39.1%
39.1% |
32.6%
32.4% |
39.8%
41.7% |
40.6%
44.1% |
NA
|
26.8%
25.2% |
| Fizz/Lulu (BC/PZ) | 44.4%
42.6% |
57.1%
63.3% |
61.7%
60.9% |
54.4%
47.6% |
80.0%
73.2% |
58.3%
55.3% |
40.6%
46.0% |
56.0%
51.0% |
73.2%
74.8% |
NA
|
| The upper value is from Last-Seasononal Players while the bottom value is from ~HighDiamond. MU with less than 30 games are not included. Order of the Archetypes based on the playrate over the last 7 days from the last-update from the upper value population. Source: Metadata of games collected with RiotGames API | ||||||||||
LoR-Meta Index (LMI)
Note: Games from Master Rank only
Tier0 with LMI \(\geq\) 97.5 Tier1 with LMI \(\in [85,97.5)\) Tier2 with LMI \(\in [60,85)\) Tier3- with LMI \(<\) 60
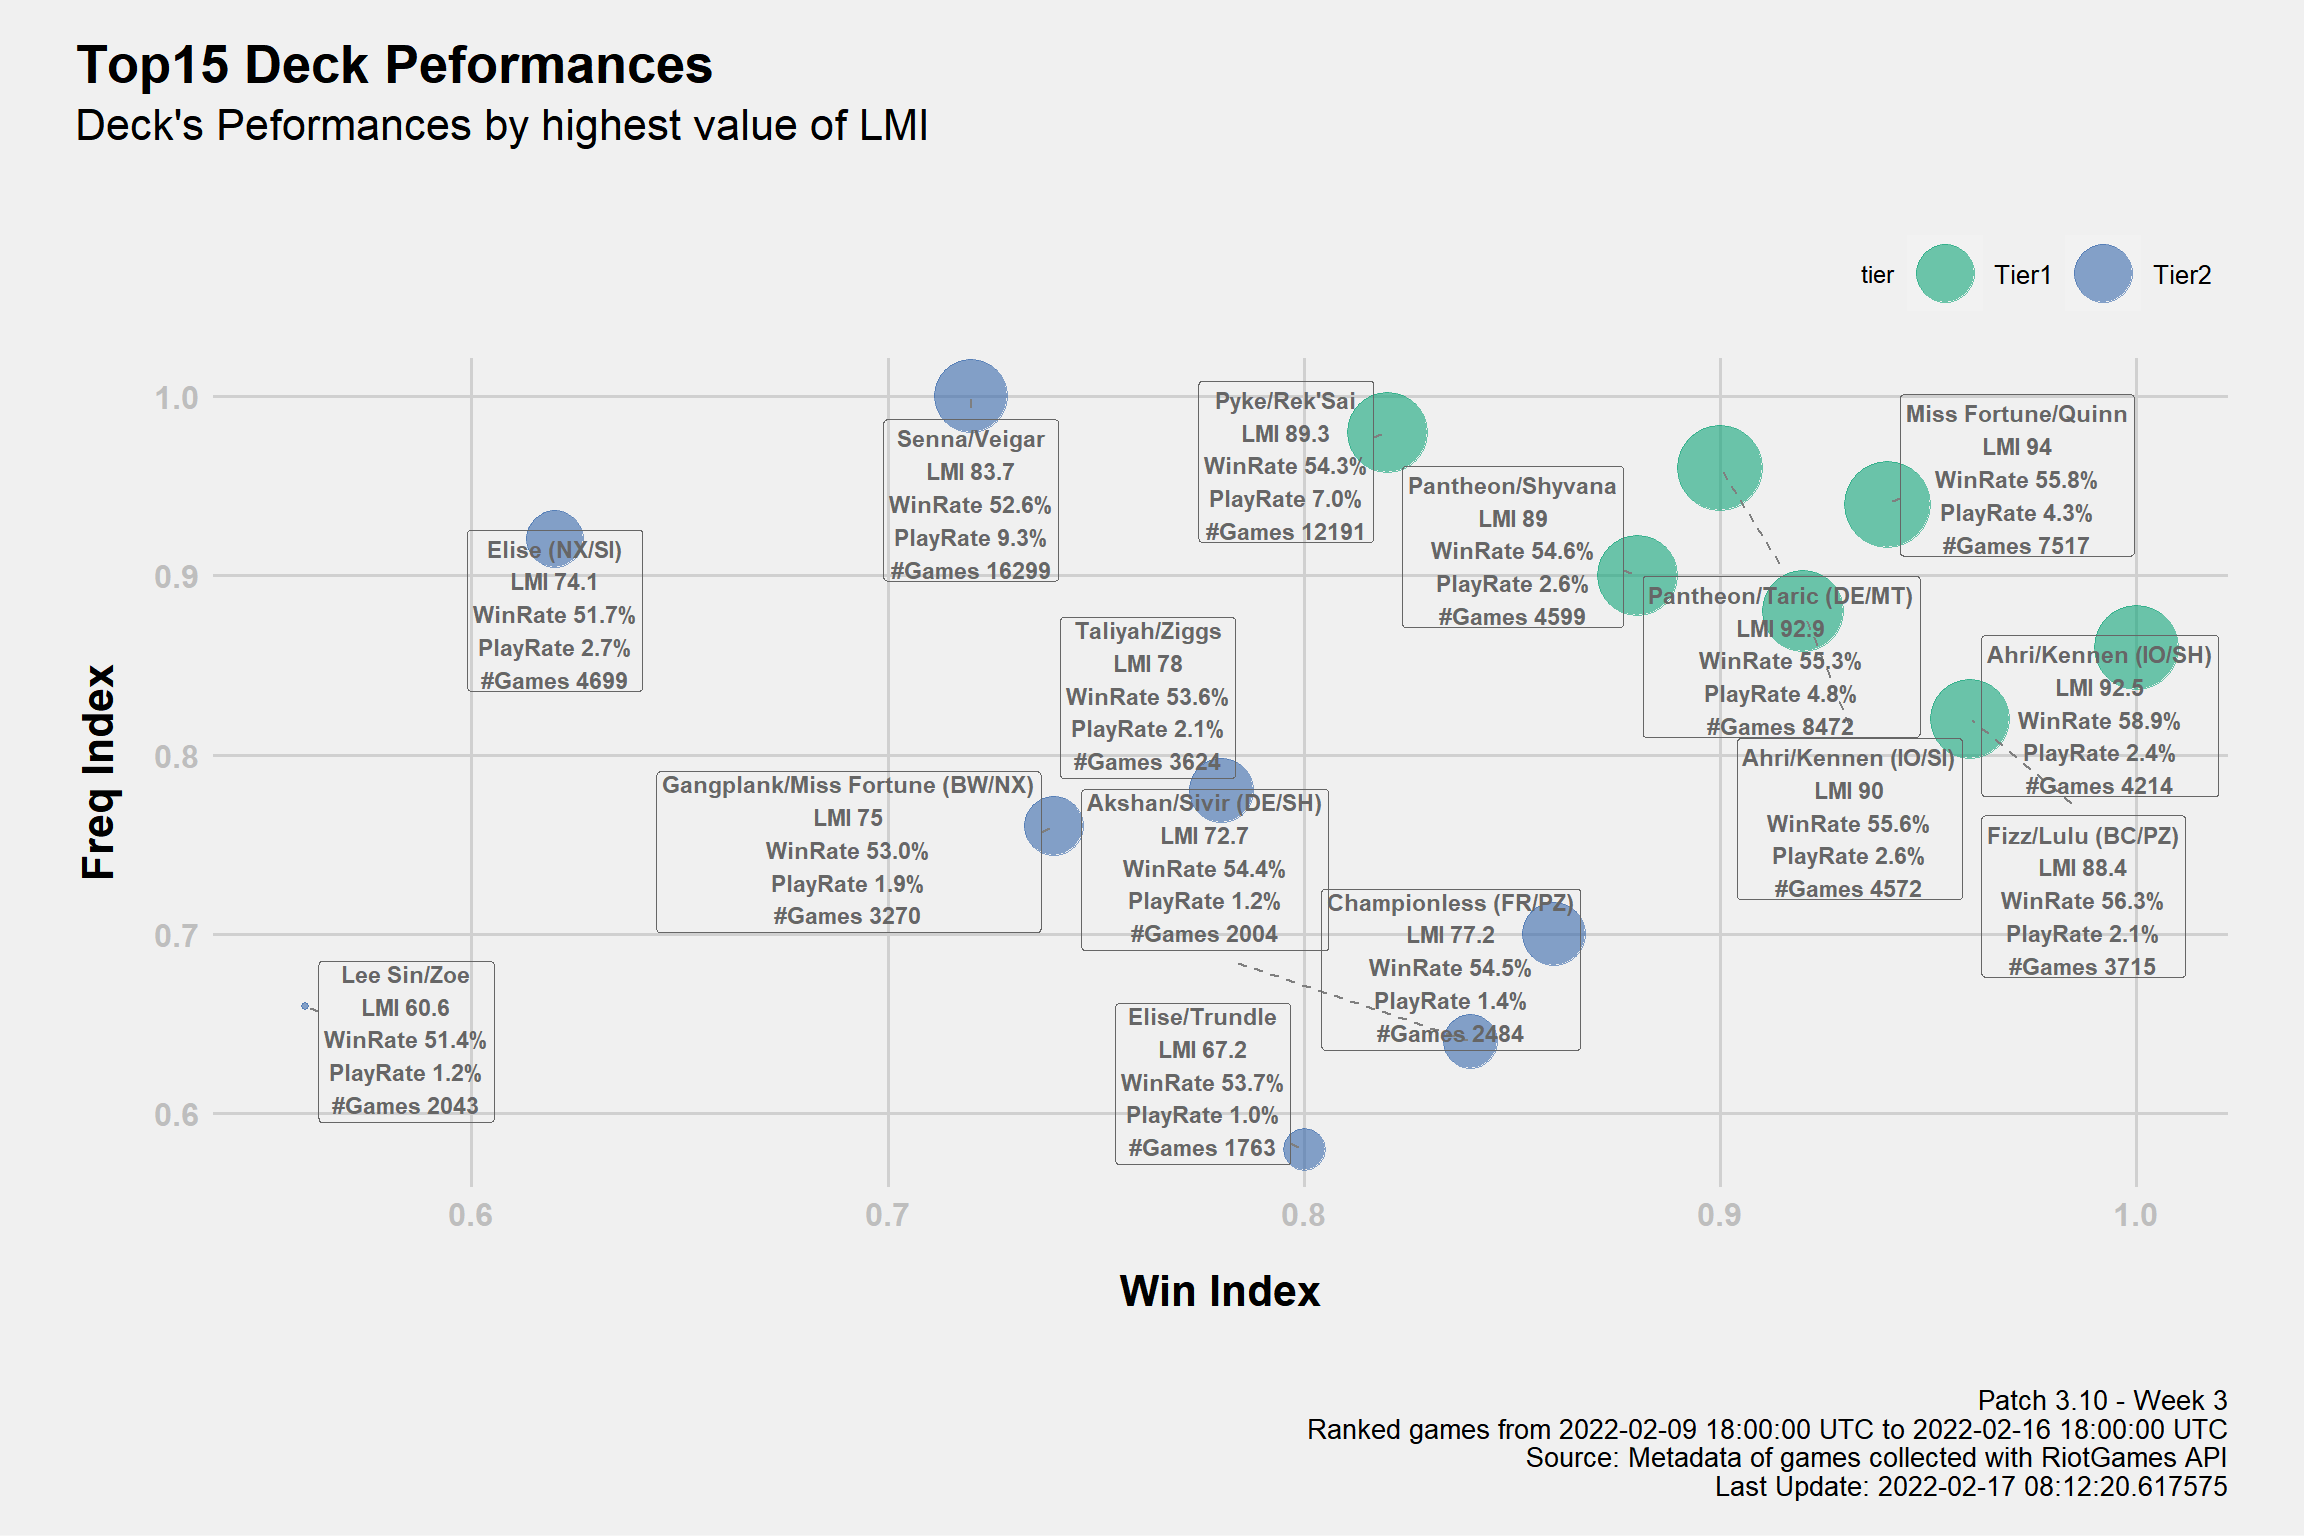
The LMI 3 4 is an Index I developed to measure the performance of decks in the metagame. For those who are familiar with basic statistical concept I wrote a document to explain the theory behind it: , it’s very similar to vicioussyndicate (vS) Meta Score from their data reaper report. The score of each deck is not just their “strength”, it takes in consideration both play rates and win rates that’s why I prefer to say it measure the “performance”. The values range from 0 to 100 and the higher the value, the higher is the performance.
Win Marathons Leaders
Top3 Players (or more in case of ties) from each server that had the highest amount of consecutive wins with the same archetype. The provided deckcode is the one played in the last win found.
| Top3 Biggest Win Streak by Server | |||
|---|---|---|---|
| Cumulative wins with the same Archetype | |||
| Player | Result | Archetype | Deck Code |
| Americas | |||
| sweatlodge | 16 | Ahri/Kennen (IO/SH) | |
| Shiny Shedinja | 15 | Pyke/Rek'Sai | |
| BulbasauruslRex | 14 | Pantheon/Shyvana | |
| danienleinad23 | 14 | Gangplank/Sejuani | |
| Kingtroll21 | 14 | Fizz/Lulu (BC/PZ) | |
| Apac | |||
| wakkiau | 15 | Ahri/Kennen (IO/SH) | |
| 잠시만요행님 | 14 | Pyke/Rek'Sai | |
| NguyenNe | 13 | Senna/Veigar | |
| ohnomywinstreak | 13 | Lulu/Zed (DE/IO) | |
| Europe | |||
| Omega | 18 | Senna/Veigar | |
| KΛRΛSU | 16 | Pyke/Rek'Sai | |
| Franky | 12 | Pantheon/Shyvana | |
| FruitBat7 | 12 | Pantheon/Taric (DE/MT) | |
| TKG Tams | 12 | Fizz/Lulu (BC/PZ) | |
| Games from all Master are collected each hour adding up to the last 20 matches. Unlikely but possible to miss games in case of high frequency games. Metadata of games collected with RiotGames API | |||
Cards Presence
Play Rate
Top 3 Play Rates by Region
Forgotten Cards
Cards that couldn’t find place even in a meme deck.
Not-Standard Archetype Names
Names and rules for the “non standard archetypes” which are not defined by Champion+Regions
| Archetype ~Fix | |
|---|---|
| Deck | Source |
| ASZ - Sivir Ionia | Akshan/Sivir (IO/SH) or Sivir/Zed or Akshan/Sivir/Zed |
| RubinBait - <Champ> | Burn Deck using <Champ> to bait mulligan |
| Dragons (DE/MT) | (DE/MT) Decks with *at least* Shyvana and ASol |
| SunDisc | Mono Shurima with 1+ Sun Disc |
| Viktor - Shellfolk | Viktor + at least one of Curious Shellfolk/Mirror Mage + at least 2 Trinket Trade |
| Sentinel Control | PnZ/SI deck with a combination of Elise/Jayce/Vi |
Credits
Special thanks to bA1ance for the recent support (ᐛ)ᕗ (January/February 2022)
Legal bla bla
This content was created under Riot Games ‘Legal Jibber Jabber’ policy using assets owned by Riot Games. Riot Games does not endorse or sponsor this project.