Top32 Seasonal Decks
Before starting the report let us end the Seasonal Data starting with the top32 decks. Some data are sadly missing because of games I couldn’t collect
Top 32 Players' Deckcodes
Source: Source: Metadata of games collected with RiotGames API
Data
Number of (Ranked) matches analyzed 52281 or 104562 games.
Insert Dead Game Memes here. With the previous season too we had a huge drop in the last weak before the new ranked season/set, no reasons to be a dog who barks at the shadows.
Last Update: 2021-10-20 18:29
Note : following my recent analysis the following decks:
Akshan / Sivir (IO/SH)
Sivir / Zed
Akshan / Sivir / Zed
Have been aggregated into a single archetype: “ASZ - Sivir Ionia”
In addition a quick fix to account for the Rubin-baits (burn decks that pretend to be other archetypes) decks have been applied and they are called:
RubinBait - Draven / Ezreal
RubinBait - Draven / Sion
RubinBait - Caitlyn / Draven - not make from Rubin but same logic
| Patch 2.17 - Week 2 - by the Numbers | ||
|---|---|---|
| Characteristic | All Games | Ranked |
| N = 128,2591 | N = 52,2812 | |
| Status | ||
| Other | 72,746 (57%) | |
| Ranked | 52,281 (41%) | |
| Friendly | 3,232 (2.5%) | |
| Server | ||
| americas | 57,073 (44%) | 22,529 (43%) |
| asia | 22,900 (18%) | 8,792 (17%) |
| europe | 48,286 (38%) | 20,960 (40%) |
|
1
Metadata from Friendly Matches (that aren't Bo3) is not recoverable,
the value may not be perfect since I lack the starting time of the game. The amount of Games to still scrap is also an estimation based on the 'position' of the game
2
n (%)
|
||
Regions
Play Rate
Plot
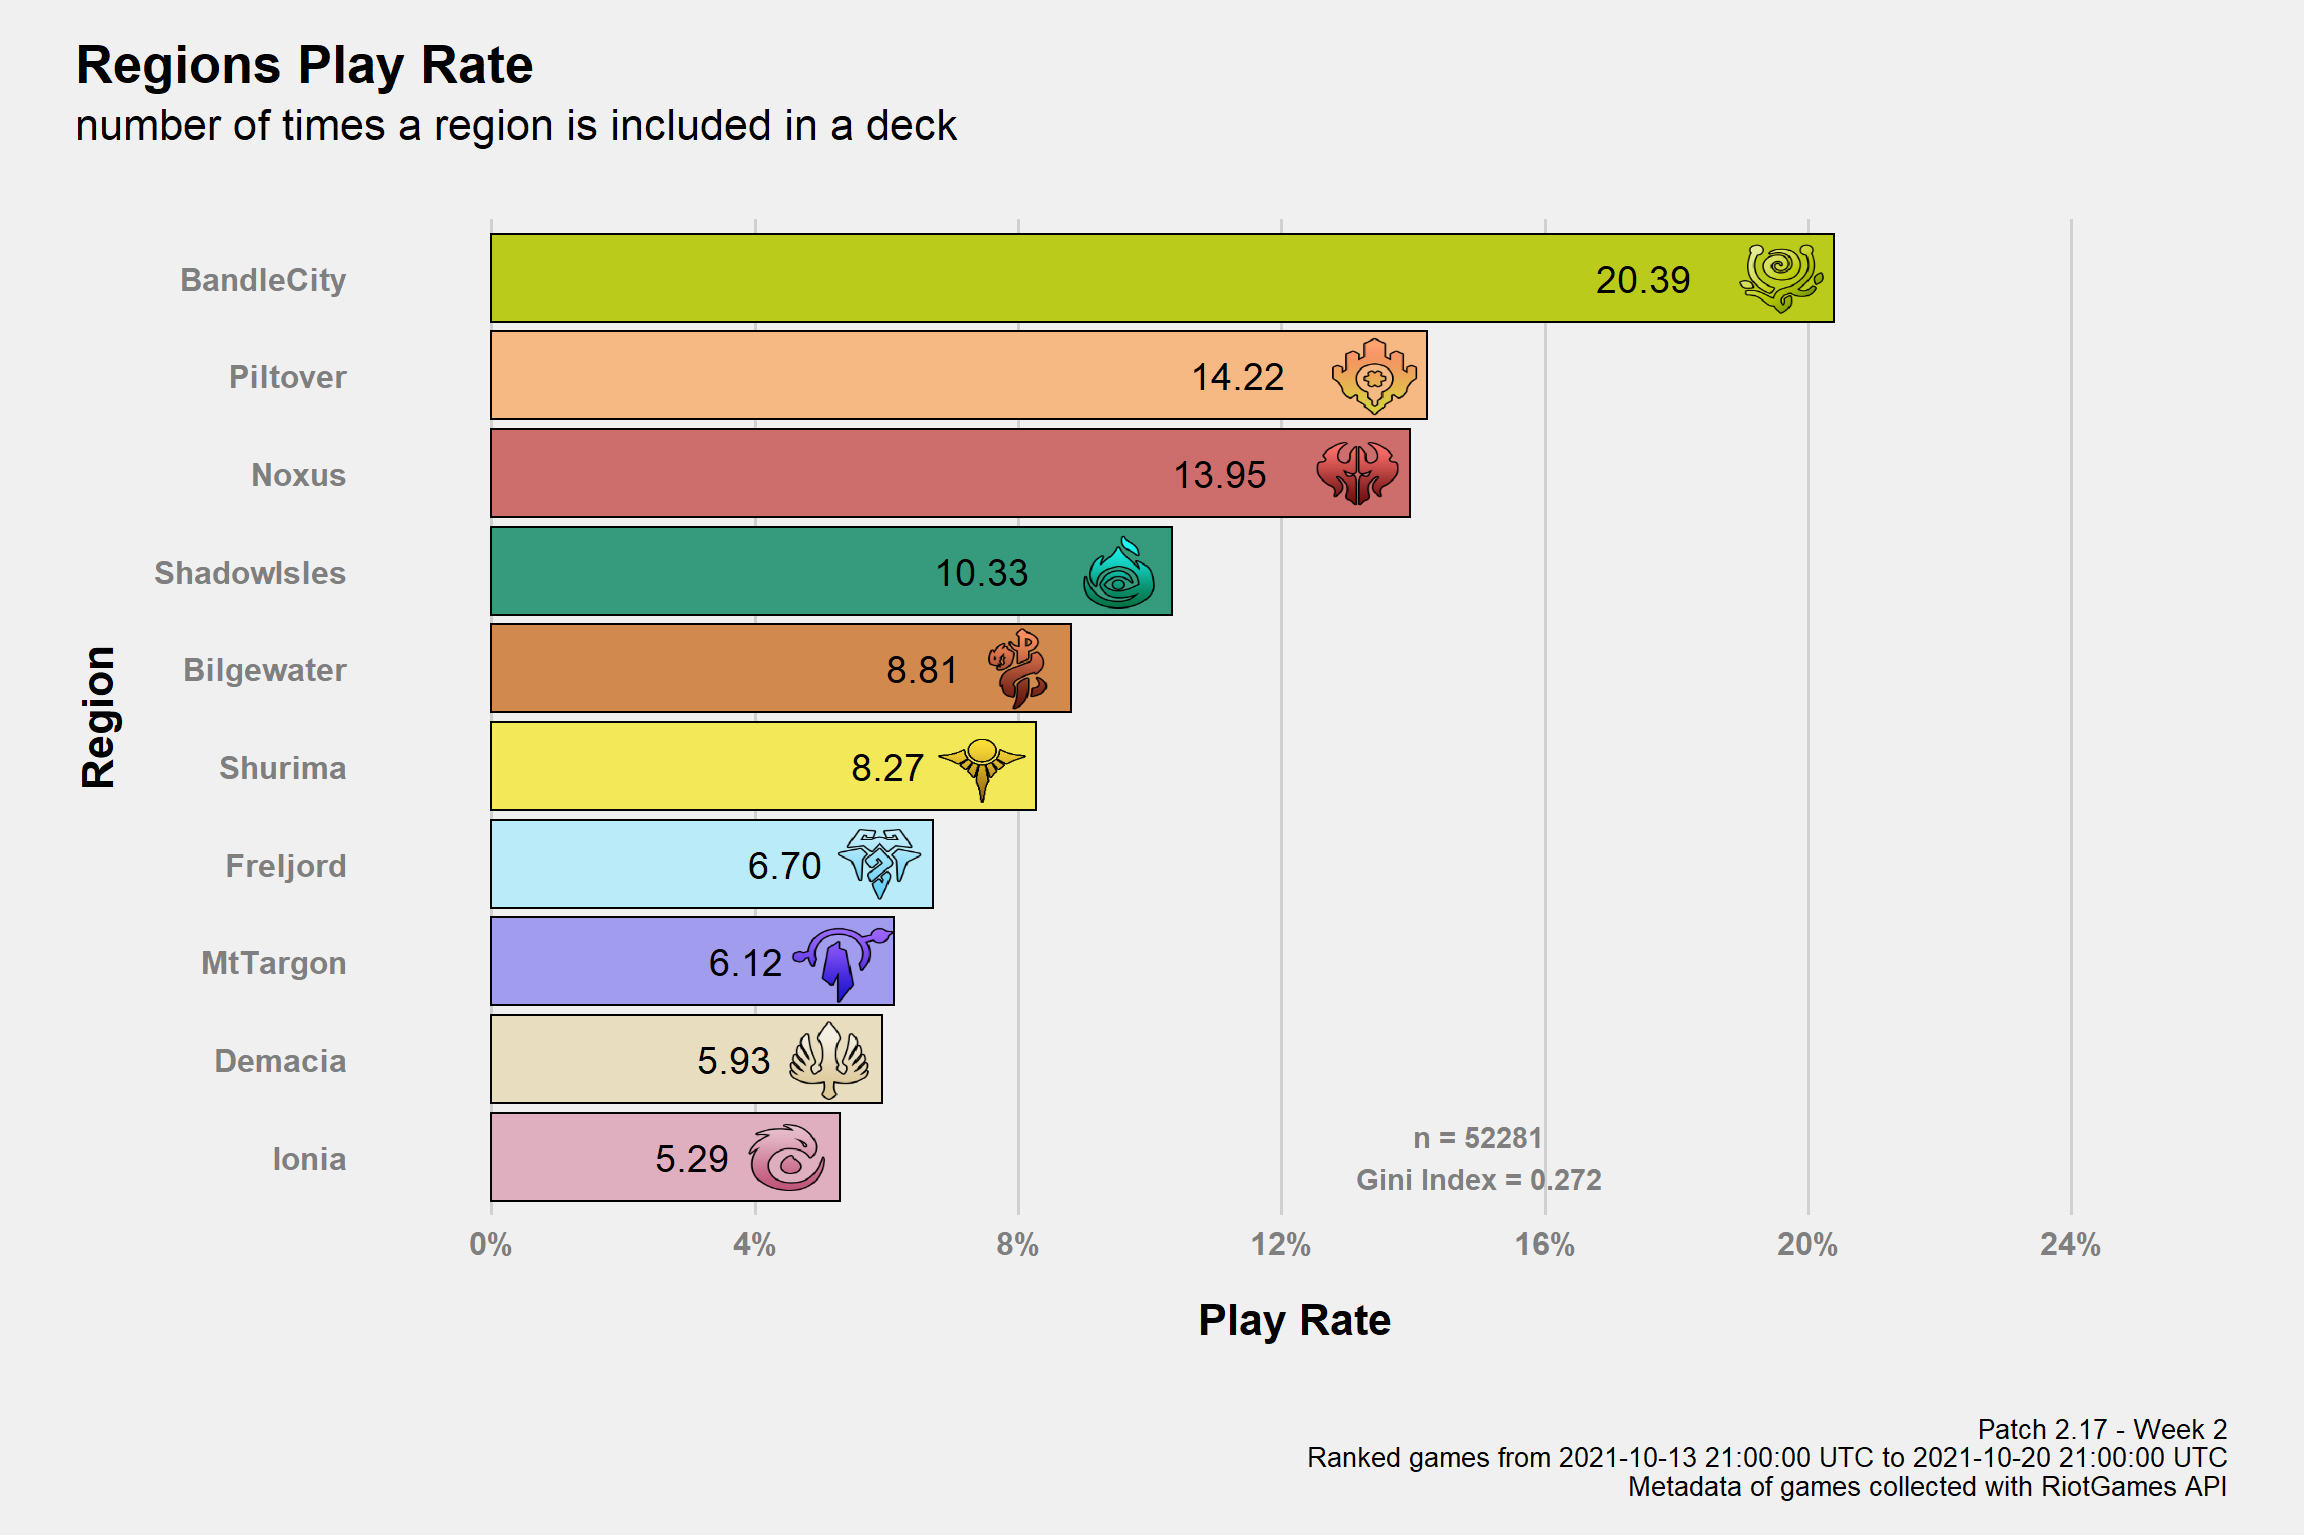
The Gini Index is a measure of heterogeneity so, in this case and in simpler terms, how much the play rates are similar. The Index goes (when normalized like here) \(in\) [0,1] and it’s equal to 1 when there’s a single value with 100% play rate or 0 when all play rates are equal. Of course a Gini Index of 1 needs to be avoided but it’s not like the aim should be 0. As said, it’s just to add some additional tools.
Table
| Region Play Rate | ||||
|---|---|---|---|---|
| Relative Frequencies by Inclusion Rate of a Region | ||||
| Region | Freq | Shard | ||
| America | Asia | Europe | ||
| BandleCity | 20.39% | 20.09% | 21.95% | 20.05% |
| Piltover | 14.22% | 13.91% | 14.19% | 14.55% |
| Noxus | 13.95% | 14.41% | 13.24% | 13.75% |
| ShadowIsles | 10.33% | 10.28% | 11.15% | 10.04% |
| Bilgewater | 8.81% | 9.21% | 9.04% | 8.28% |
| Shurima | 8.27% | 8.79% | 7.26% | 8.12% |
| Freljord | 6.70% | 6.01% | 5.44% | 7.98% |
| MtTargon | 6.12% | 6.45% | 5.38% | 6.07% |
| Demacia | 5.93% | 5.33% | 6.33% | 6.41% |
| Ionia | 5.29% | 5.51% | 6.03% | 4.74% |
| Patch 2.17 - Week 2 Ranked games from 2021-10-13 21:00:00 UTC to 2021-10-20 21:00:00 UTC Metadata of games collected with RiotGames API | ||||
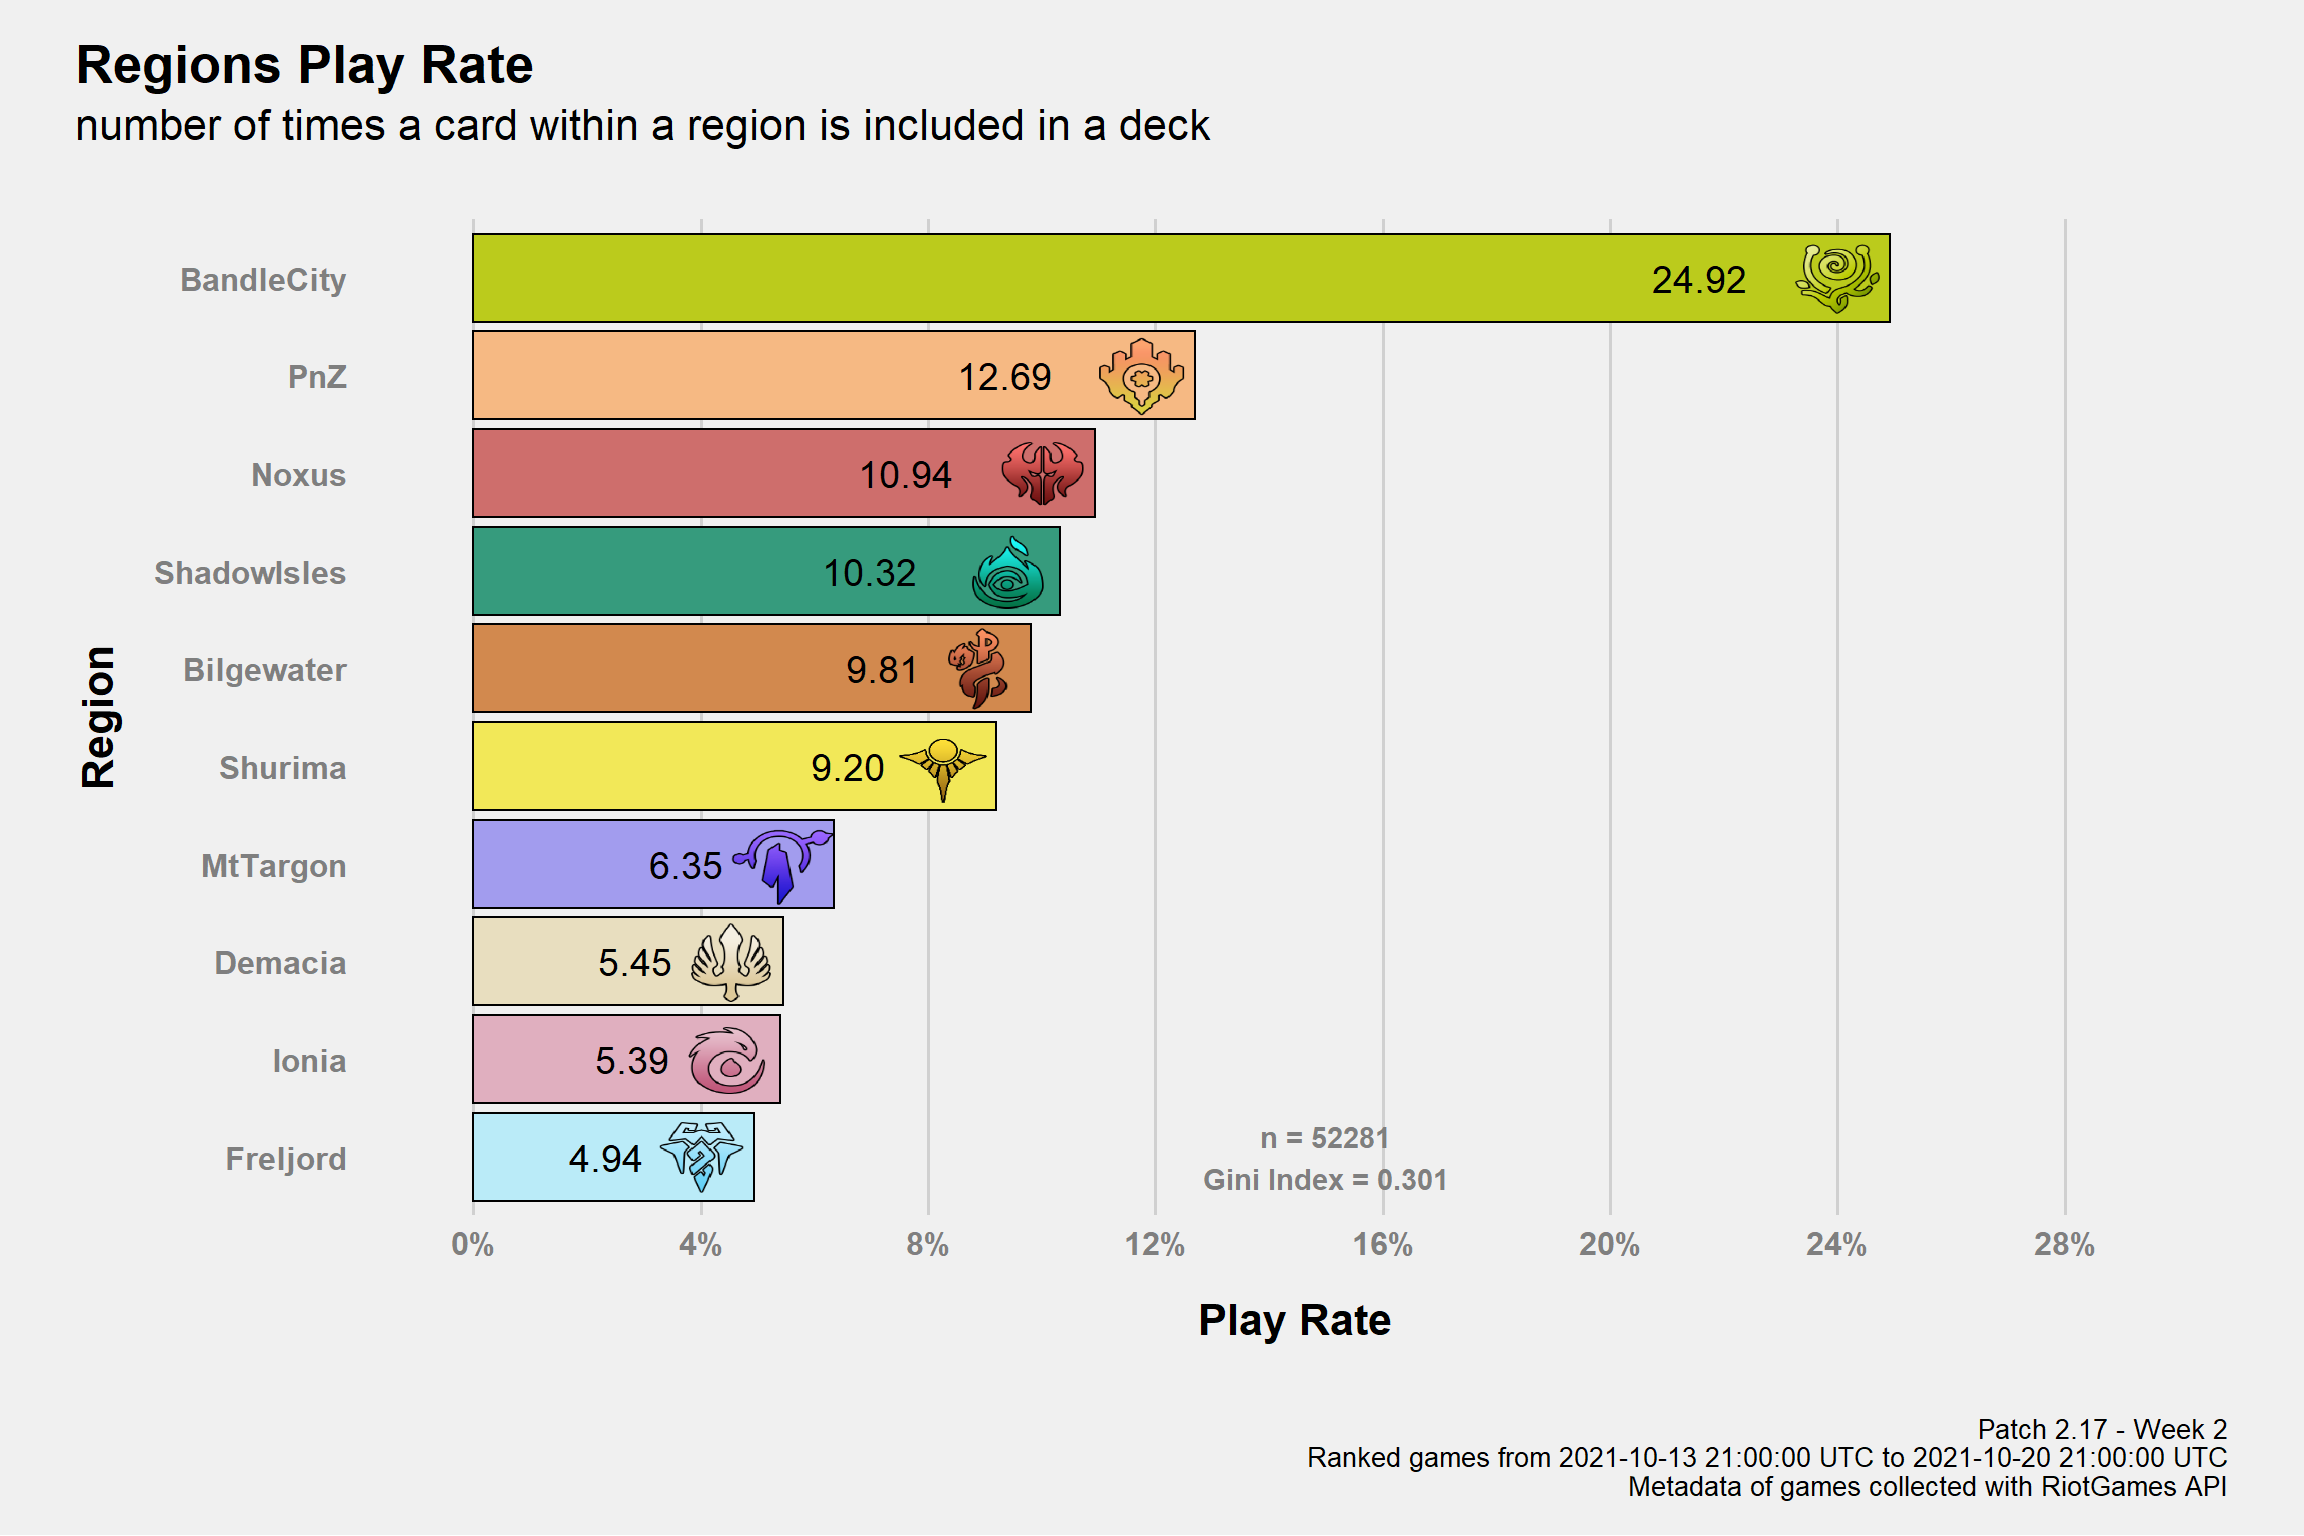
Play Rate by number of Cards
Note: currently all dual region cards have only their main region as possible value assigned. The same problem also apply to the card’s inclusion rates, with Lulu being the most notable case affected by this.
Plot
Table
| Region Play Rate | ||||
|---|---|---|---|---|
| Relative Frequencies by number of times a Card within a Region is included in a Deck | ||||
| Region | Freq | Shard | ||
| America | Asia | Europe | ||
| BandleCity | 24.92% | 24.65% | 26.63% | 24.49% |
| PnZ | 12.69% | 12.32% | 13.36% | 12.80% |
| Noxus | 10.94% | 11.12% | 10.71% | 10.83% |
| ShadowIsles | 10.32% | 10.63% | 9.73% | 10.23% |
| Bilgewater | 9.81% | 10.13% | 9.99% | 9.39% |
| Shurima | 9.20% | 9.78% | 7.90% | 9.12% |
| MtTargon | 6.35% | 6.68% | 5.57% | 6.32% |
| Demacia | 5.45% | 4.96% | 6.04% | 5.74% |
| Ionia | 5.39% | 5.49% | 5.81% | 5.11% |
| Freljord | 4.94% | 4.23% | 4.27% | 5.97% |
| Patch 2.17 - Week 2 Ranked games from 2021-10-13 21:00:00 UTC to 2021-10-20 21:00:00 UTC Metadata of games collected with RiotGames API | ||||
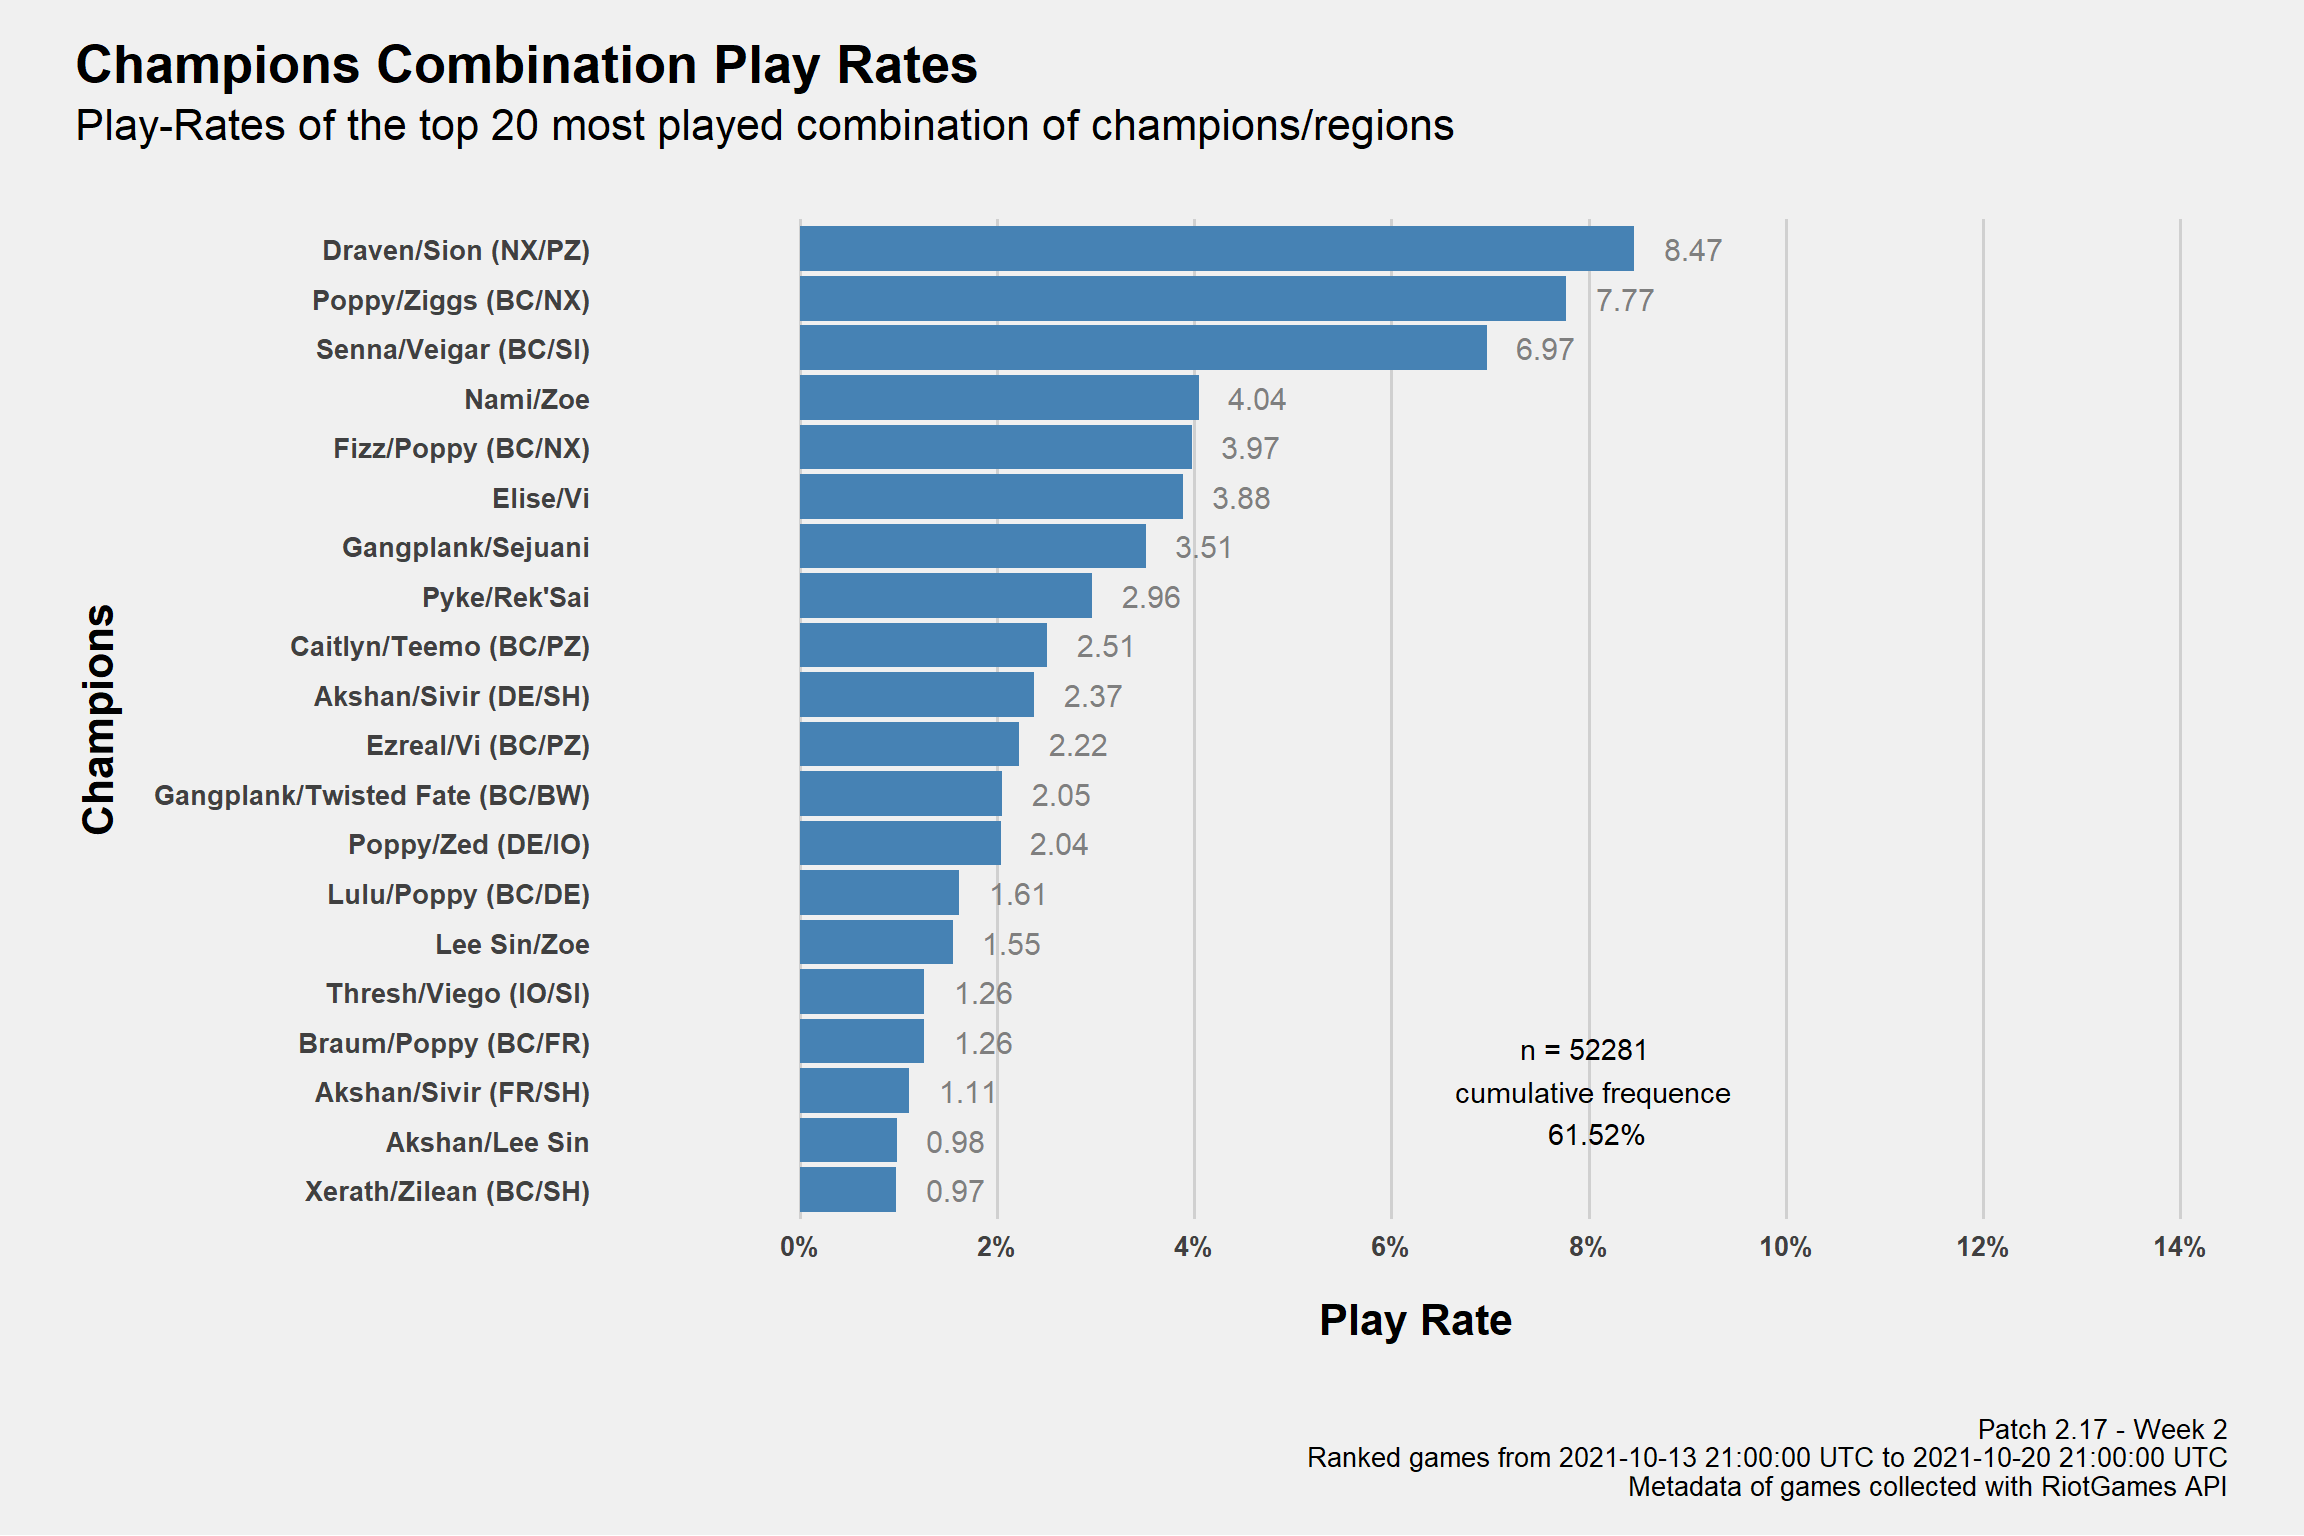
Champions Combinations
Play Rates
Plot
Table
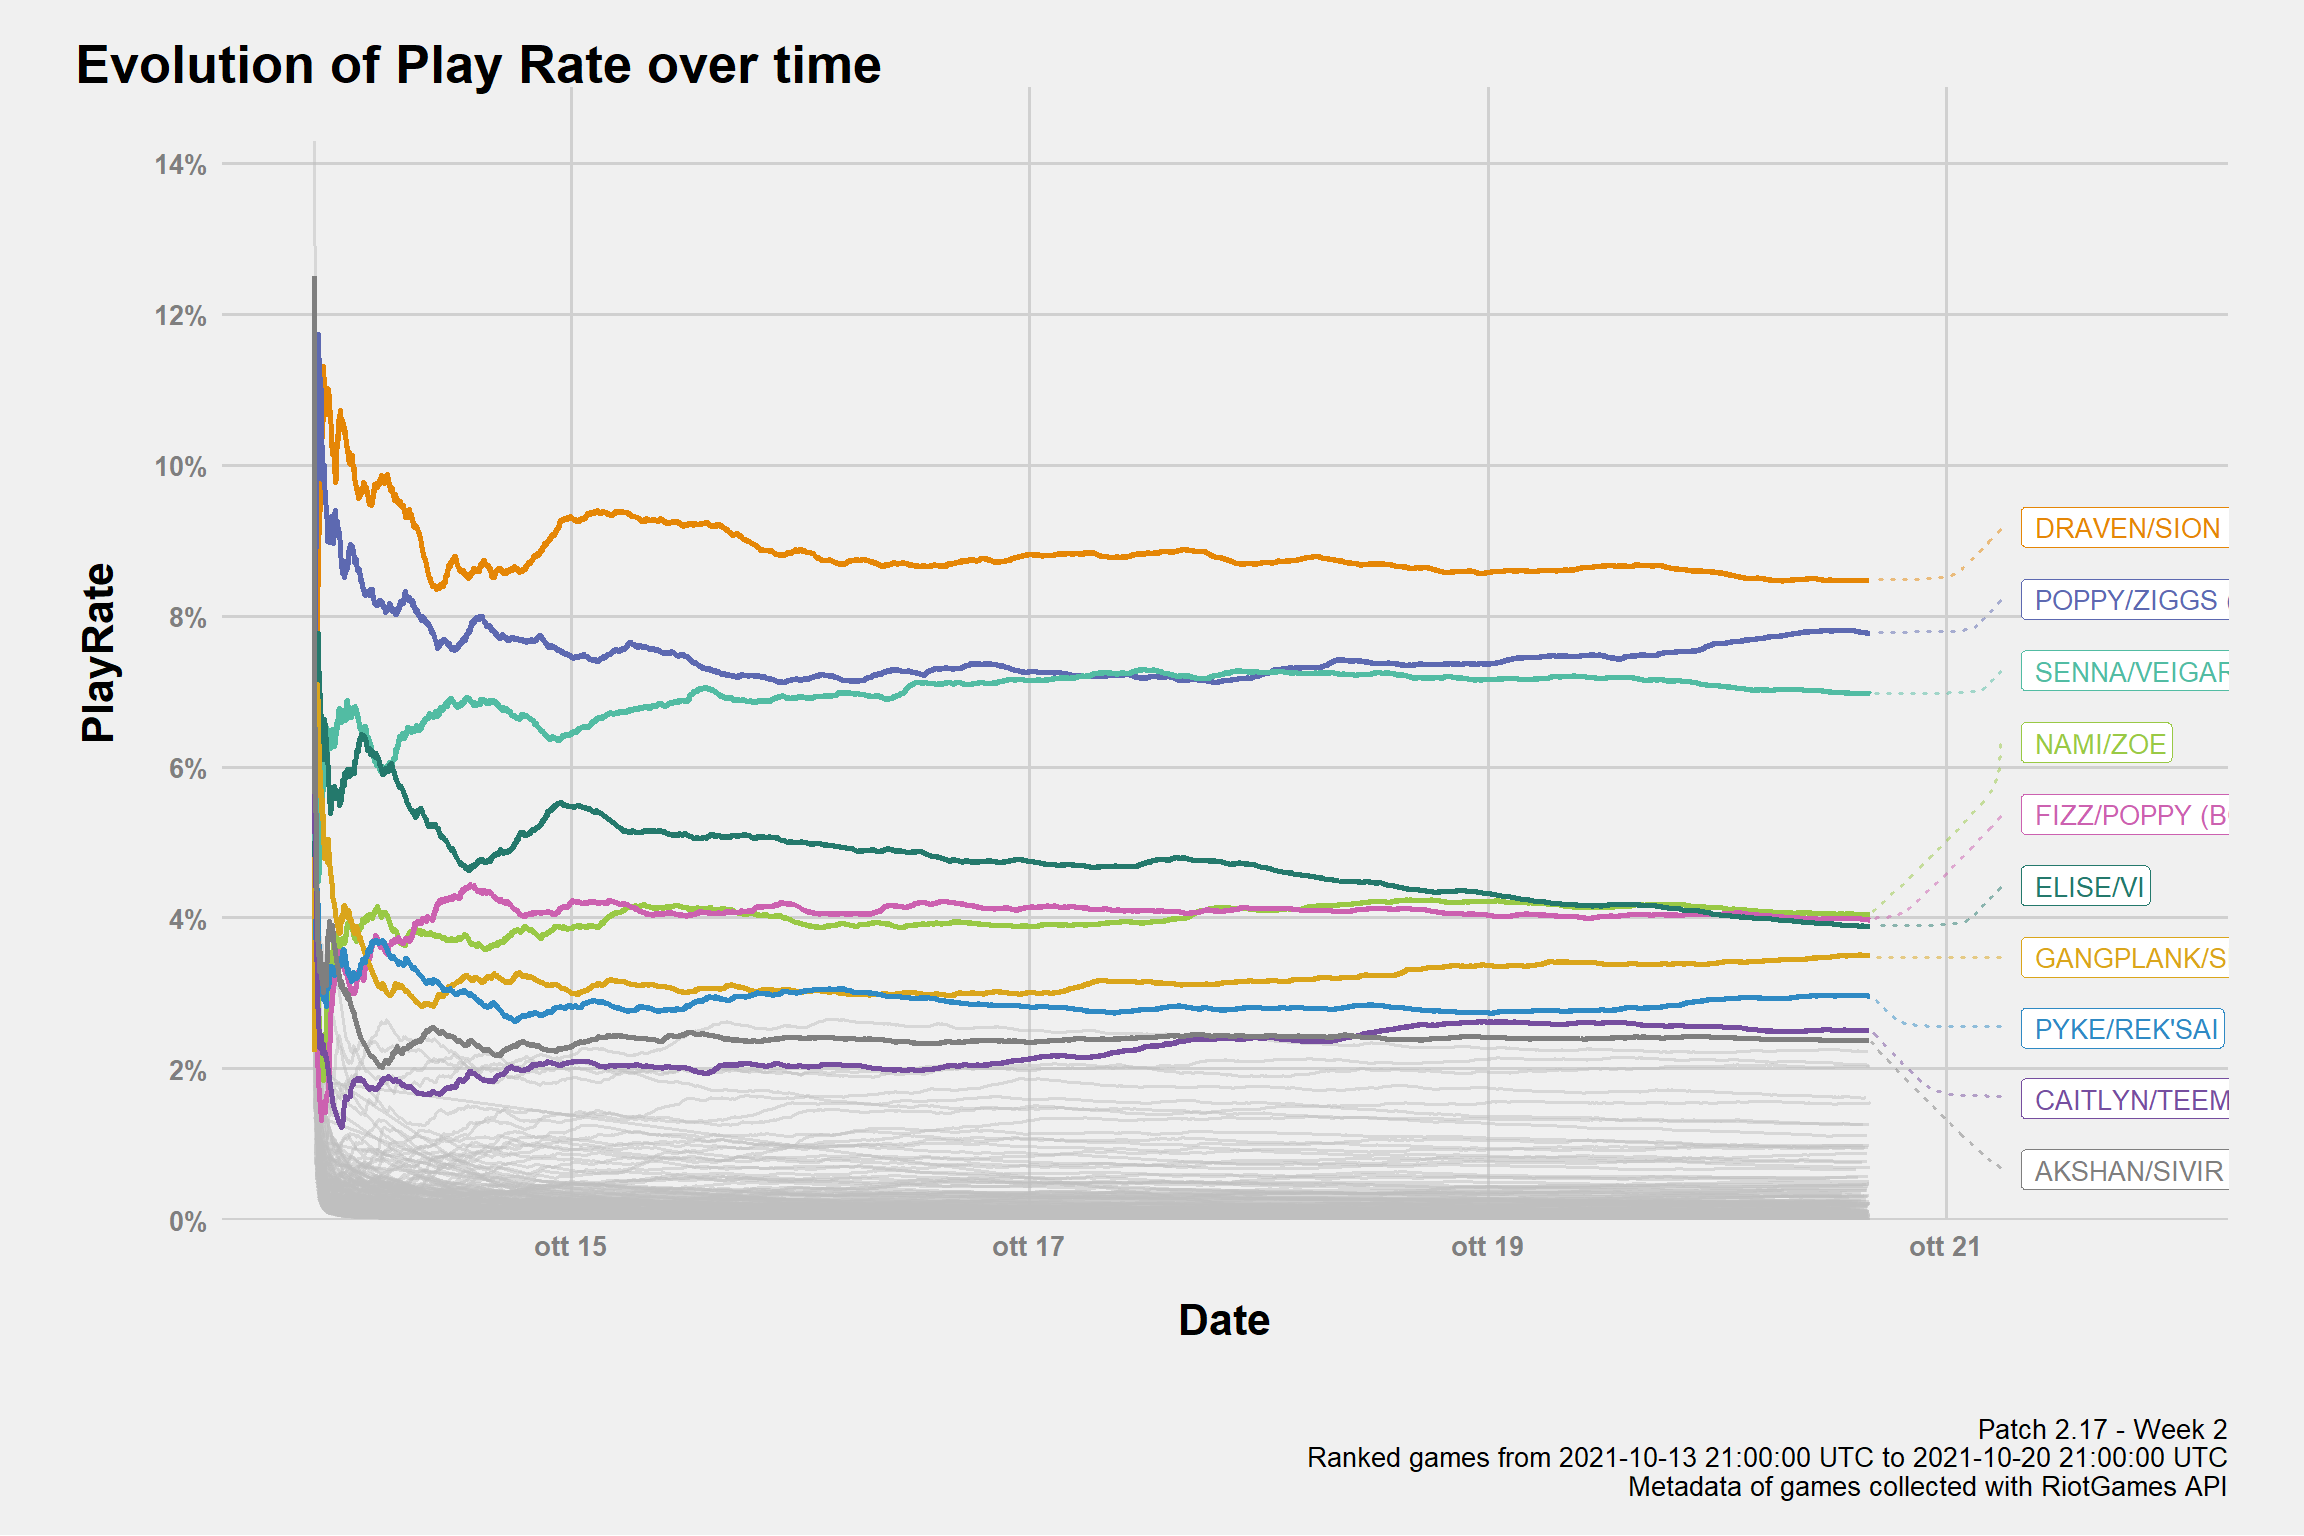
Day by Day
Highlisting the top10 most played decks (at the moment of the last game played).
Win Rates
Tie games are excluded
Meta Decks
Win rates of the most played combination of champions. Play Rate >= 1% in at least one of the servers.
Underdog
Top Win rates of the top10 best performing least played combination of champions. Play rate \(\in\) [0.1%,1%)1
Match Ups
Important: Since Dragons are probably going to be meta again I’m leaving the last MU grid of when they were meta to let anyone check what could be still strong into them. I wanted to display the image but I always have trouble with loading images so to avoid display just an hard to read picture I’m going to leave this button to easily download the grid.
Note: Regarding MU, this is not the most accurate estimation you can get from my data. If you want a better picture of the current meta it would be better to look at the dedicated MU-page where I use all “Ranked” games with the current sets of buffs and nerfs. While one may object I don’t account for optimizations and differences in skills acquired during the weeks, the overall number of games / sample size makes them a better source of information. So, in case, pls refer to the MU - page for a better “meta-investigation”.
Match-up Grid
The win rates on the grid are among the 15 most played champion combination.
MatchUps | Draven/Sion (NX/PZ) | Poppy/Ziggs (BC/NX) | Senna/Veigar (BC/SI) | Nami/Zoe | Fizz/Poppy (BC/NX) | Elise/Vi | Gangplank/Sejuani | Pyke/Rek'Sai | Caitlyn/Teemo (BC/PZ) | Akshan/Sivir (DE/SH) | Ezreal/Vi (BC/PZ) | Gangplank/Twisted Fate (BC/BW) | Poppy/Zed (DE/IO) | Lulu/Poppy (BC/DE) | Lee Sin/Zoe |
Draven/Sion (NX/PZ) | 67% | 49% | 38% | 50% | 69% | 44% | 72% | 50% | 68% | 54% | 43% | 57% | 67% | 30% | |
Poppy/Ziggs (BC/NX) | 33% | 54% | 61% | 54% | 40% | 65% | 68% | 70% | 55% | 61% | 45% | 59% | 58% | 42% | |
Senna/Veigar (BC/SI) | 51% | 46% | 54% | 33% | 55% | 43% | 48% | 50% | 44% | 47% | 46% | 37% | 32% | 62% | |
Nami/Zoe | 62% | 39% | 46% | 47% | 39% | 57% | 36% | 70% | 41% | 48% | 52% | 27% | 37% | 46% | |
Fizz/Poppy (BC/NX) | 50% | 46% | 67% | 53% | 35% | 50% | 58% | 54% | 49% | 57% | 33% | 45% | 39% | 70% | |
Elise/Vi | 31% | 60% | 45% | 61% | 65% | 50% | 41% | 69% | 38% | 53% | 60% | 61% | 51% | 46% | |
Gangplank/Sejuani | 56% | 35% | 57% | 43% | 50% | 50% | 51% | 57% | 60% | 59% | 43% | 41% | 46% | 48% | |
Pyke/Rek'Sai | 28% | 32% | 52% | 64% | 42% | 59% | 49% | 51% | 49% | 67% | 52% | 52% | 38% | 62% | |
Caitlyn/Teemo (BC/PZ) | 50% | 30% | 50% | 30% | 46% | 31% | 43% | 49% | 23% | 37% | 29% | 25% | 34% | 27% | |
Akshan/Sivir (DE/SH) | 32% | 45% | 56% | 59% | 51% | 62% | 40% | 51% | 77% | 60% | 53% | 62% | 40% | 57% | |
Ezreal/Vi (BC/PZ) | 46% | 39% | 53% | 52% | 43% | 47% | 41% | 33% | 63% | 40% | 49% | 62% | 62% | 50% | |
Gangplank/Twisted Fate (BC/BW) | 57% | 55% | 54% | 48% | 67% | 40% | 57% | 48% | 71% | 47% | 51% | 44% | 55% | 43% | |
Poppy/Zed (DE/IO) | 43% | 41% | 63% | 73% | 55% | 39% | 59% | 48% | 75% | 38% | 38% | 56% | 45% | 54% | |
Lulu/Poppy (BC/DE) | 33% | 42% | 68% | 63% | 61% | 49% | 54% | 62% | 66% | 60% | 38% | 45% | 55% | 62% | |
Lee Sin/Zoe | 70% | 58% | 38% | 54% | 30% | 54% | 52% | 38% | 73% | 43% | 50% | 57% | 46% | 38% |
Match-up Table
Decks of the week
I don’t know who created the deck, if it was MChamploo who has the most games or not but this seems to be the combination of genius/madness
Braum/Poppy (BC/FR)
Deckcodes
How to read the table:
- Play rate: How often a card is included in this class of decks / the table is order by this column.
- 3/2/1 is the relative and absolute frequency of the number of copies in the decks that plays them
- Frequencies from 50% to 100% are colored from shades of green to white to identify more easily the highest values
LoR-Meta Index (LMI)
Tier0 with LMI >= 97.5
Tier1 with LMI \(\in\) [85,97.5)
Tier2 with LMI \(\in\) [60,85)
Tier3 or lower with LMI < 60
Note: Hovering over a circle will display a deck values.
The LMI 2 3 is an Index I developed to measure the performance of decks in the metagame. For those who are familiar with basic statistical concept I wrote a document to explain the theory behind it: , it’s very similar to vicioussyndicate (vS) Meta Score from their data reaper report. The score of each deck is not just their “strength”, it takes in consideration both play rates and win rates that’s why I prefer to say it measure the “performance”. The values range from 0 to 100 and the higher the value, the higher is the performance.
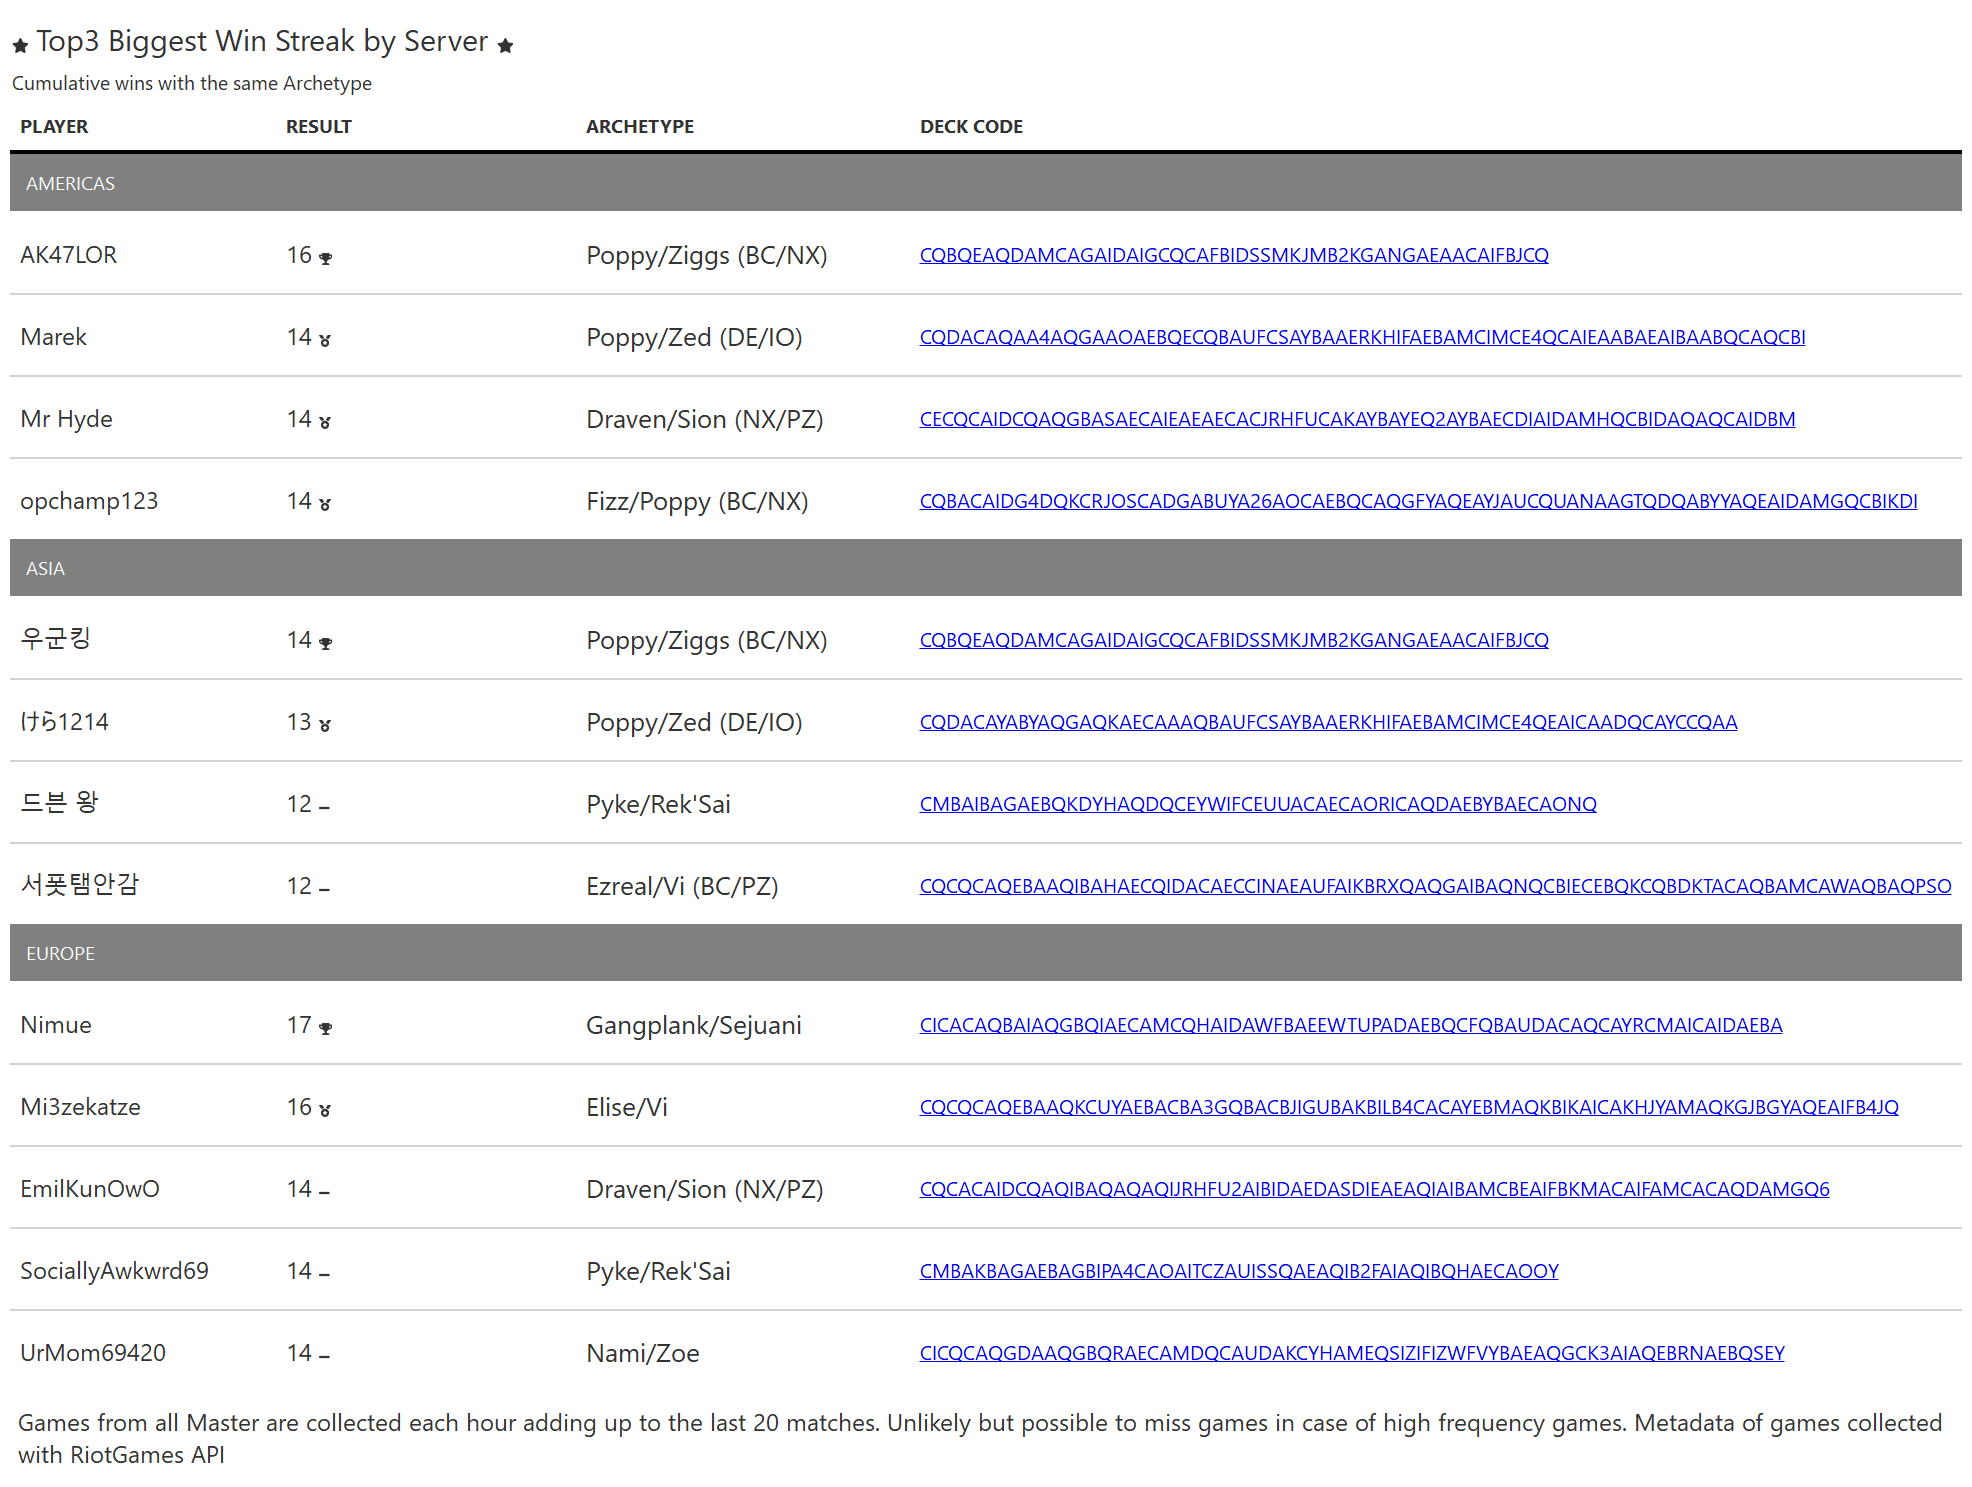
Win Marathons Leaders
Top3 Players (or more in case of ties) from each server that had the highest amount of consecutive wins with the same archetype. The provided deckcode is the one played in the last win found.
Cards Presence
Play Rate
It seems that not even Twin Disciple can beat Sharsight
Top 3 Play Rates by Region
Forgotten Cards
Cards that couldn’t find place even in a meme deck.
Legal bla bla
This content was created under Riot Games ‘Legal Jibber Jabber’ policy using assets owned by Riot Games. Riot Games does not endorse or sponsor this project.
Min number of games 50, during the times a meta/ladder just changed.↩︎