Data
Last Update: 2021-08-18 23:15
| Seasonal Open Rounds - by the Numbers | ||
|---|---|---|
| Coverage reached regarding the Rise of the Underworld Open Rounds Matches | ||
| Server | Players | Games |
| Asia | 269/(?) | 4078 |
| Europe | 1007/1024(?) | 14502 |
| Americas | 1001/1024(?) | 13974 |
| games extracted with Riot API, last update on 2021-08-18 23:15:38.87094 | ||
The following data is related to the the number of games missing to recreate a match.So when I could only collect either a win or a loss or both a win and a loss but not the remaining game. It is not the total number of missing games as it doesn’t account for the cases where I lack all games but that value can’t be known as it’s impossible to know whenever the round was played or not.
Surprisingly enough it seems I recovered almost all information for individual matches. So, the missing cases are matches were I lack all games.
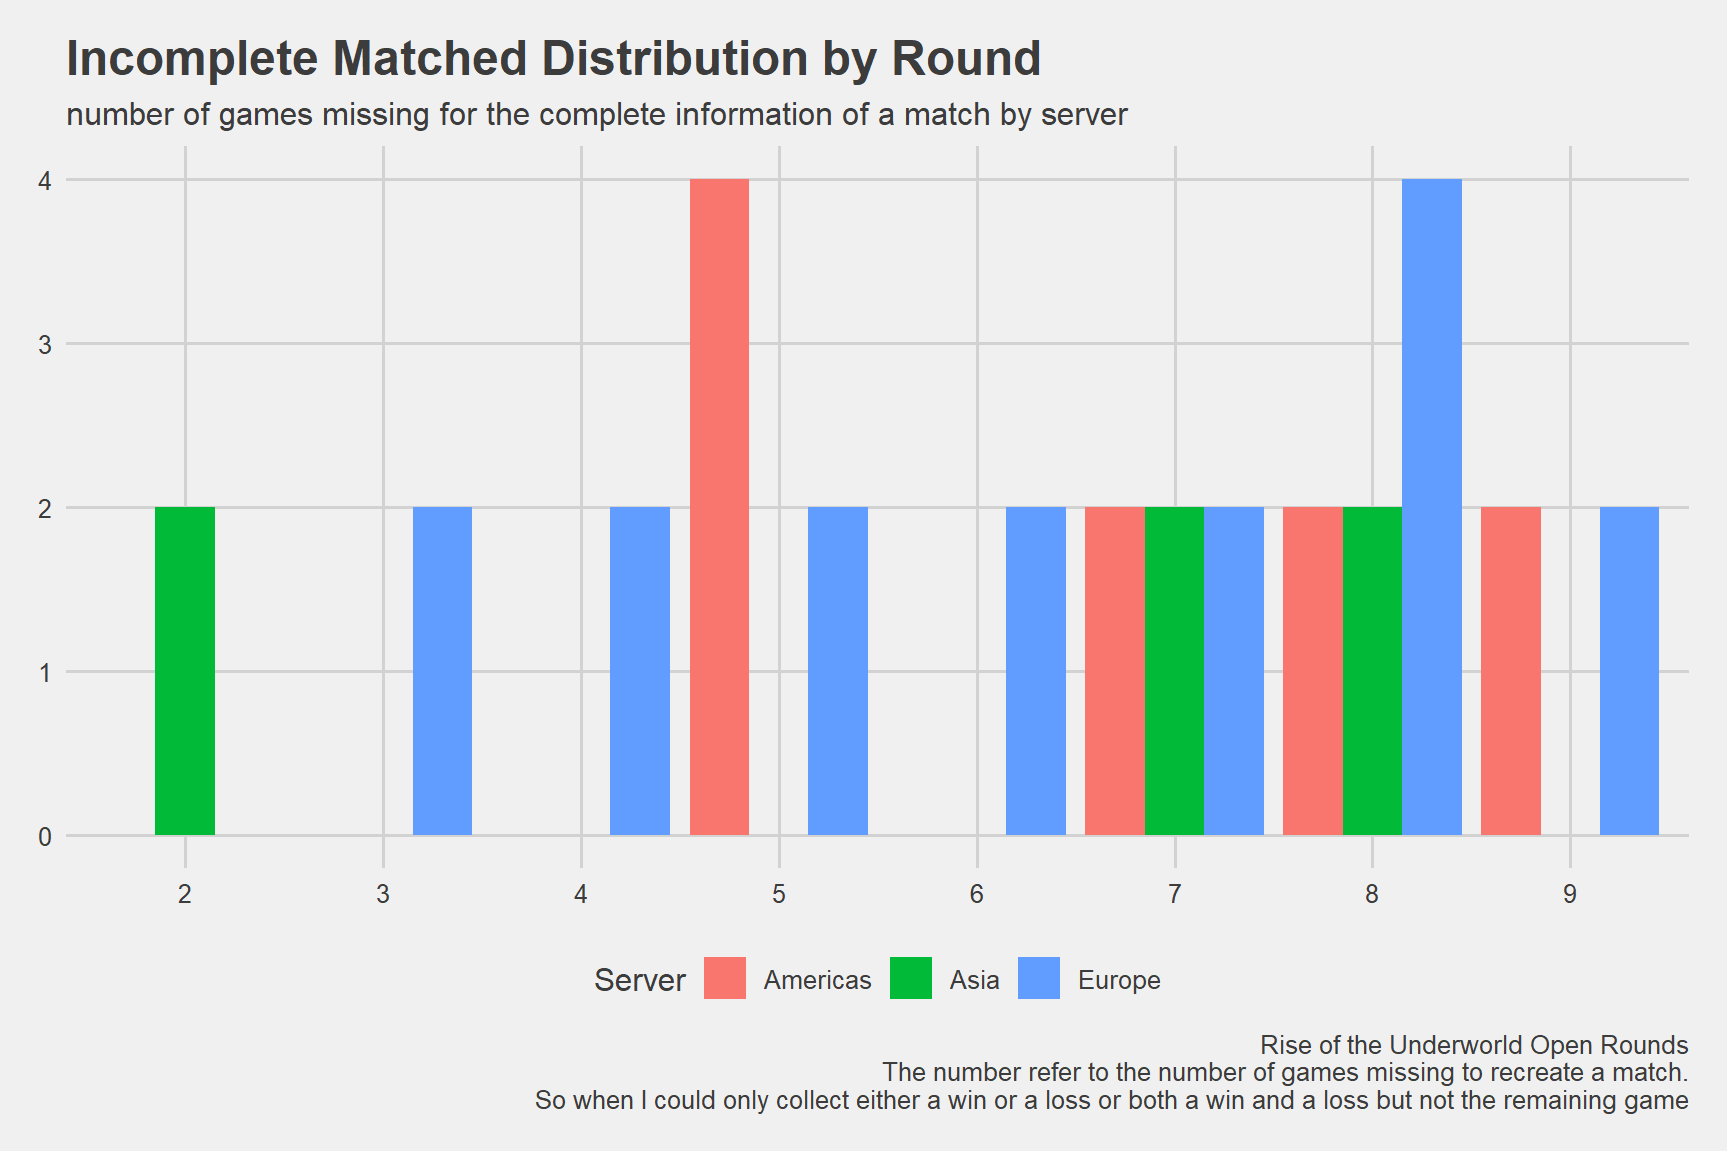
Figure 1: Uncomplete Matches Distribution
| Characteristic | americas, N = 101 | asia, N = 61 | europe, N = 161 |
|---|---|---|---|
| Round | |||
| 2 | 0 (0%) | 2 (33%) | 0 (0%) |
| 3 | 0 (0%) | 0 (0%) | 2 (12%) |
| 4 | 0 (0%) | 0 (0%) | 2 (12%) |
| 5 | 4 (40%) | 0 (0%) | 2 (12%) |
| 6 | 0 (0%) | 0 (0%) | 2 (12%) |
| 7 | 2 (20%) | 2 (33%) | 2 (12%) |
| 8 | 2 (20%) | 2 (33%) | 4 (25%) |
| 9 | 2 (20%) | 0 (0%) | 2 (12%) |
|
1
n (%)
|
|||
Regions
Play Rate
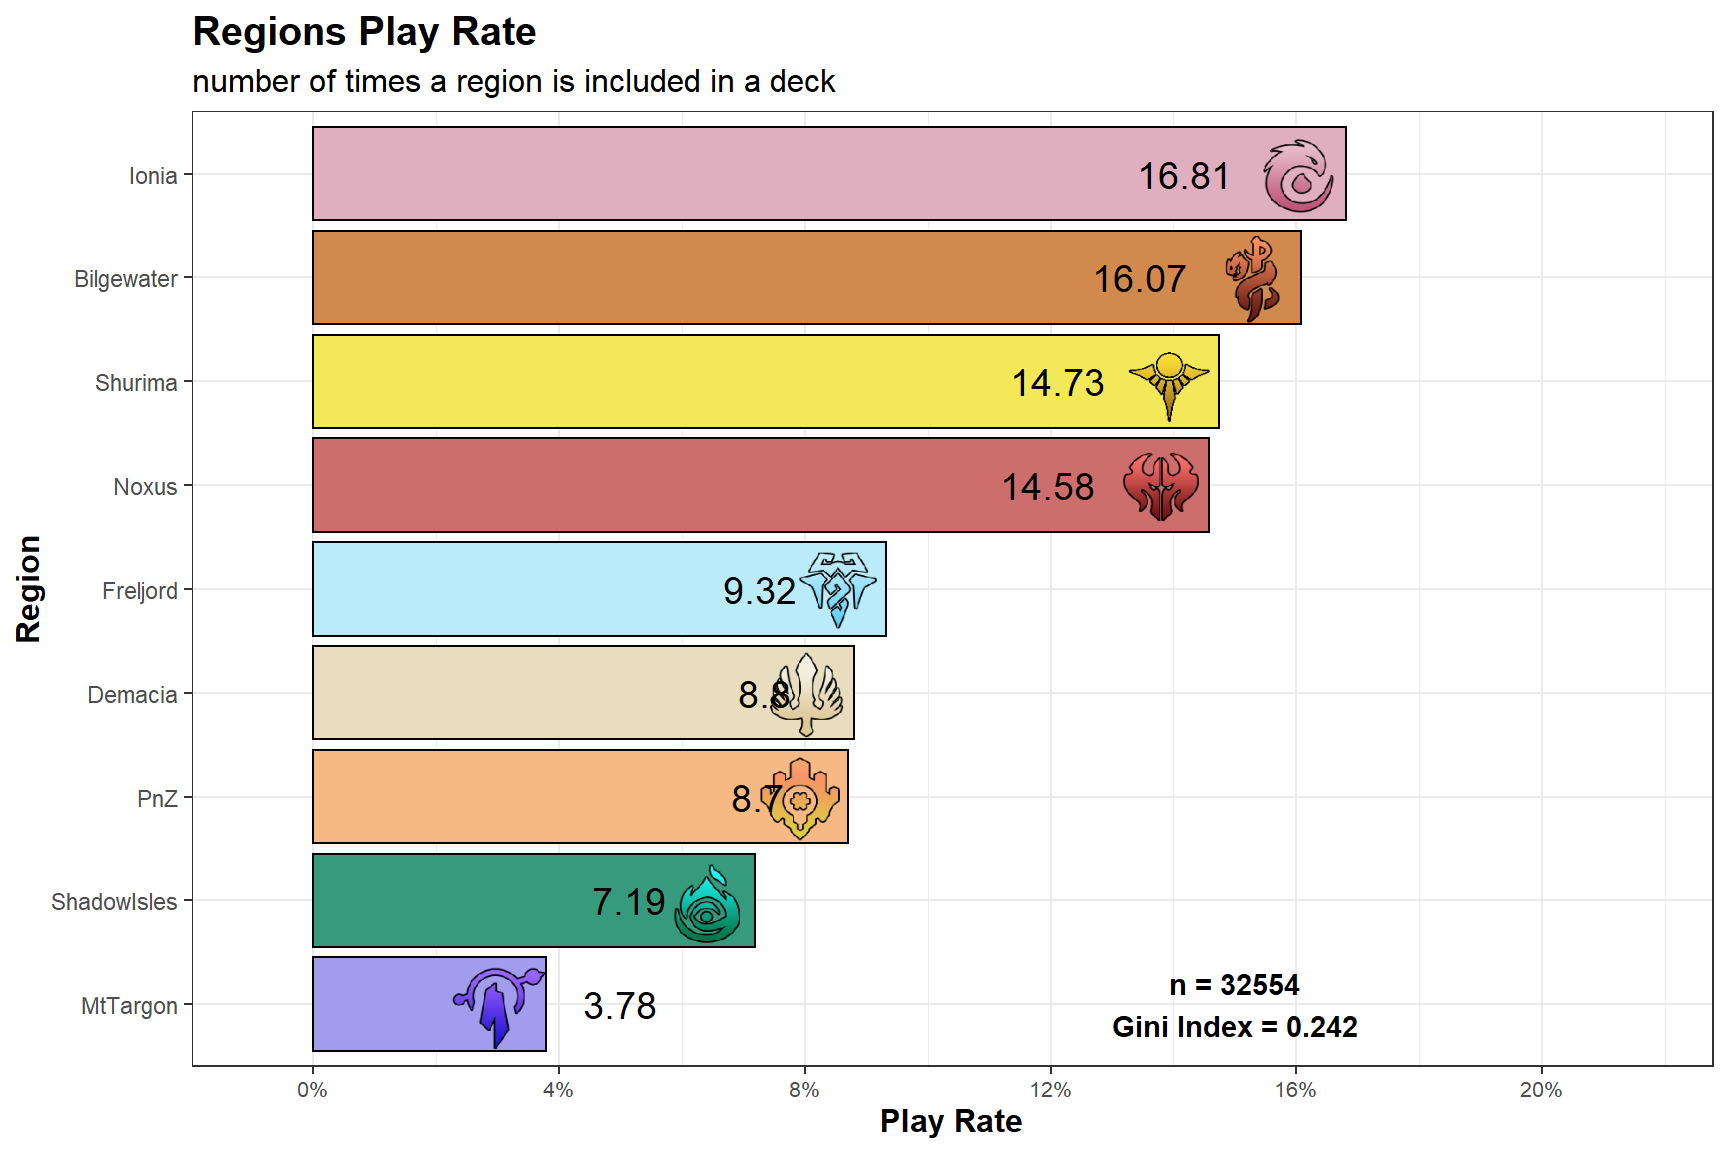
The Gini Index is a measure of heterogeneity so, in this case and in simpler terms, how much the play rates are similar. The Index goes (when normalized like here) in [0,1] and it’s equal to 1 when there’s a single value with 100% play rate or 0 when all play rates are equal. Of course a Gini Index of 1 needs to be avoided but it’s not like the aim should be 0. As said, it’s just to add some additional tools.
While this information is higly correlated to the champions of choice I wanted to add an information about the distribution of the combination of Regions. I decided to use the absolute frequencies as the percentenges would result all quite low and harder to compare.
| Region Play Rate | ||||
|---|---|---|---|---|
| Relative Frequencies by Inclusion Rate of a Region | ||||
| Region | Freq | Shard | ||
| America | Asia | Europe | ||
| Ionia | 16.81% | 16.20% | 19.13% | 16.74% |
| Bilgewater | 16.07% | 16.33% | 14.08% | 16.39% |
| Shurima | 14.73% | 14.41% | 16.44% | 14.57% |
| Noxus | 14.58% | 15.05% | 13.48% | 14.45% |
| Freljord | 9.32% | 9.13% | 8.62% | 9.69% |
| Demacia | 8.80% | 8.55% | 10.92% | 8.46% |
| PnZ | 8.70% | 8.88% | 7.30% | 8.92% |
| ShadowIsles | 7.19% | 7.52% | 6.72% | 7.00% |
| MtTargon | 3.78% | 3.93% | 3.31% | 3.78% |
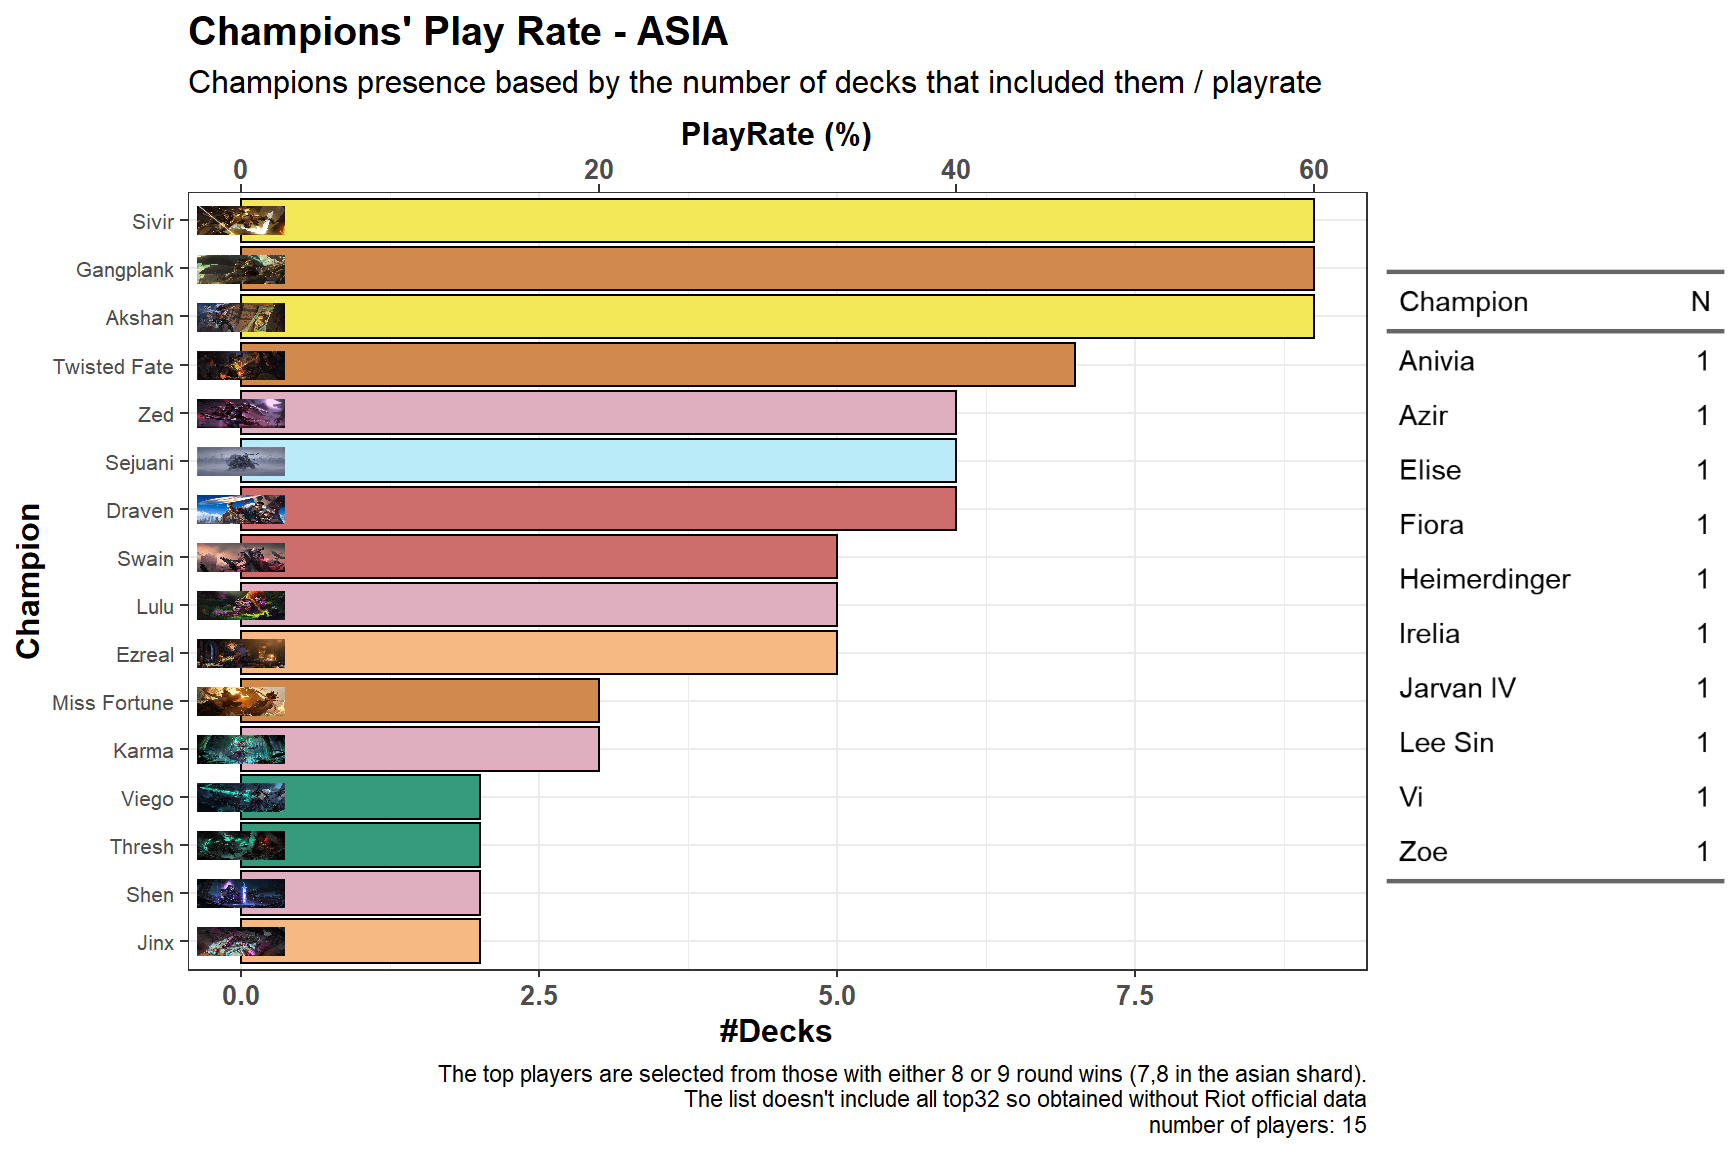
Top Player(?) Champions of Choice
This section is done before the release of the official top32 list from Riot.
Note: Yeah, the usage of images is lacking at the momento
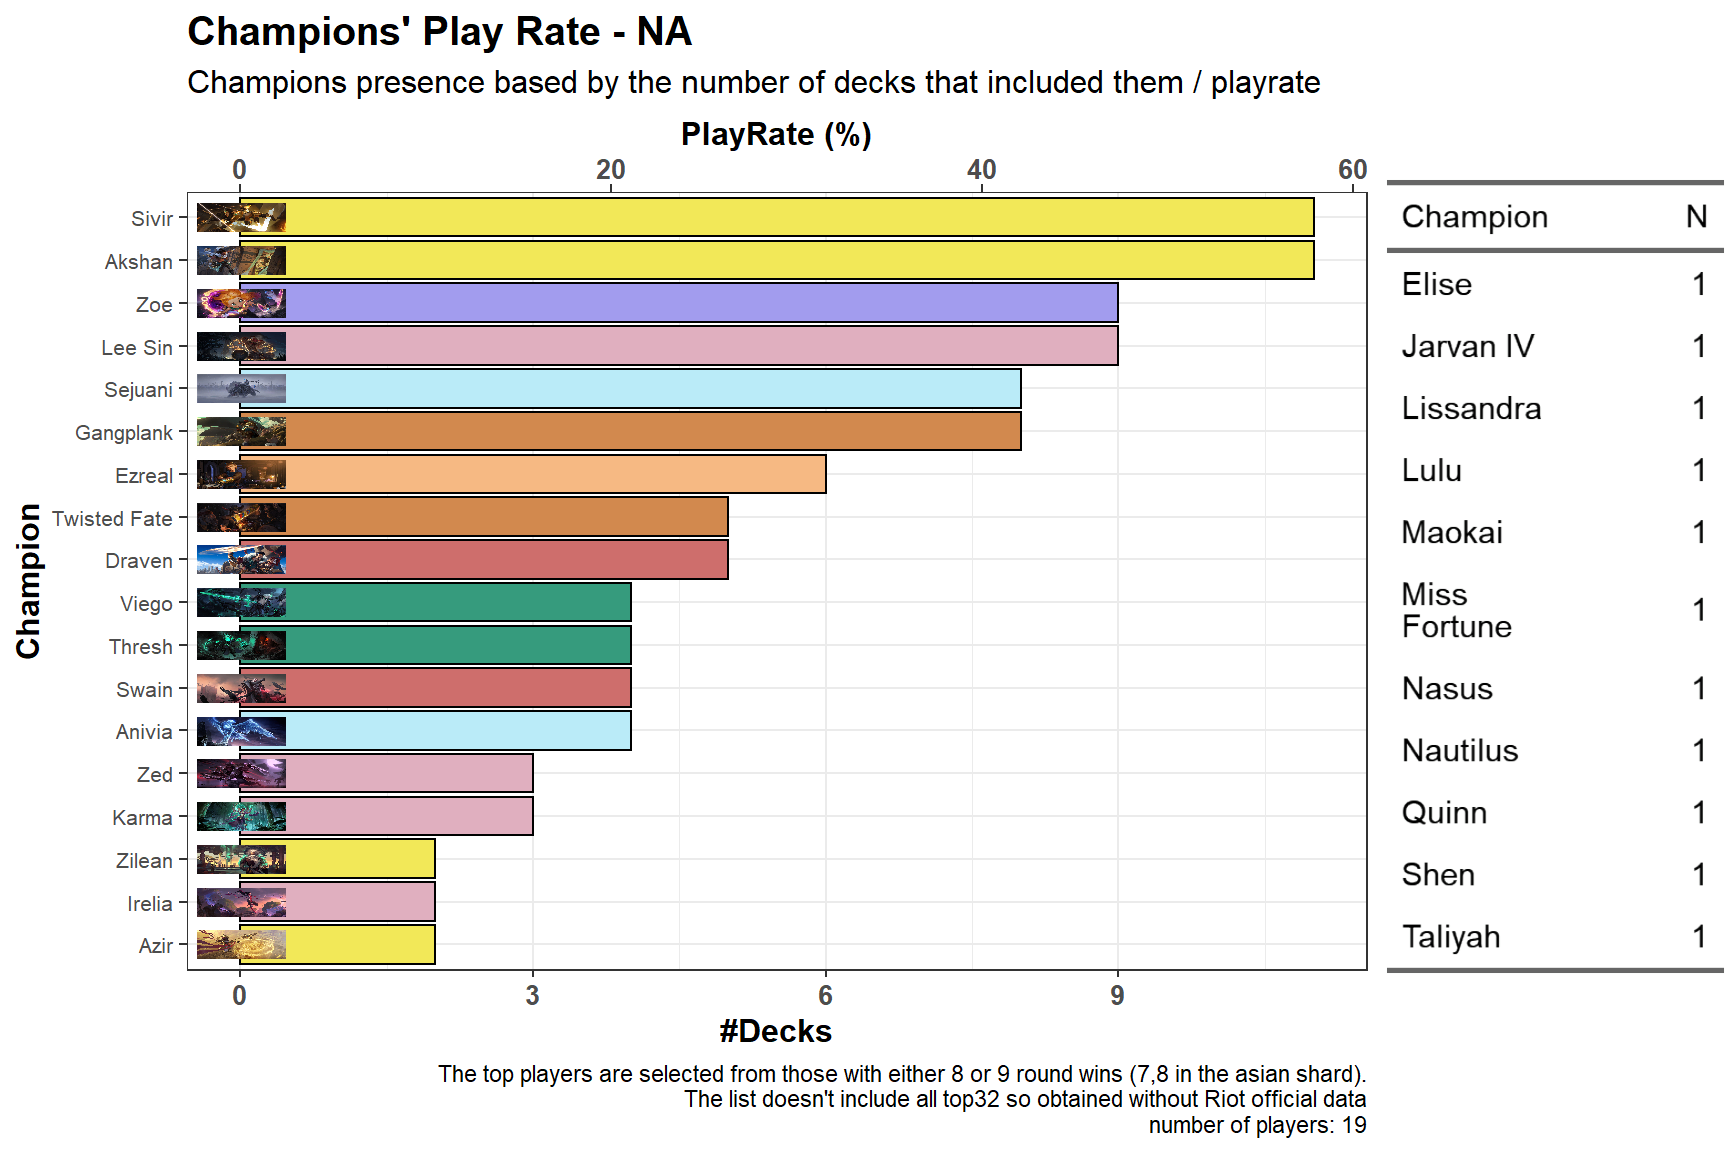
Line Ups
Let’s now take a look to the overall LineUps.
Sadly the tournament setting is showing the limitation of my approach to define archetypes by looking at champion + regions because during the open rounds, compared to the ladder, we can see an increase of “tech” cards in the form of champions like Twisted Fate for Plunder decks.
Bans (and WinRates)
Note: This section use only decks with full knowledge of the Line-Ups. Other decks are excluded
We saw the line ups brought, but what was actually used? This is sadly not only tricky to compute but also impossible in some case where a player used only one of his/her deck.
What follows is a table containing the ban rates for each deck computeted in two different ways:
- Mean Ban Rate by Line Up: mean value of the ban rate for each deck among all Line Ups that contains it.
Example: 100 LineUps, 99 with Azir/Irelia with 100% ban rate and 1 with 0% ban rate -> Mean Ban Rate by Line Up = (100x99+0x1)/100 = 99%
- Ban Rate: ratio of number of ban of a deck among all bans acrooss line ups that contains such deck.
Example: 100 LineUps, 99 with Azir/Irelia with 1 games and Azir / Irelia banned in each istance (100% ban rate) and 1 line up with 0 ban but 100 games (0% ban rate) -> Ban Rate = (1x99+0)/199 = ~49.7%
cases with at least 10 games
LMI - Tournament Edition
When I wrote the basic theory about the index I mentioned how it’s a concept that can be expanded whenever I can find more (appropriate) variable to add. At the previous Seasonal I already had an idea but had no time to apply it. In this case I added the information regarding the ban rate of a deck.
Short explanation: Since now we have 3 variables there two options to consider, either they are used independently as before, or a new step is added a mid-tier aggregation. Since ban rate are always associated with pick rates (p&b) I dediced to create a “p&b dimension” that is composed by the play rate and ban rate. I applied the quantile normalization to use the same scale and the play rate, but there was an option to leave the value raw, the important part is probably leave decks with 0% ban rate to remain 0 and this happens with most transformations. the play rate and ban rate are aggregated with a weighed mean (but in this case with equals weights) the resulting p&b-dimension-index is normalized and then finally aggregated to create the LMI. This is just a quick application of the theory but a more rigorous approach will require testing all the steps with the new framework
TLDR: Added the ban rate, will write an update on the theory
Note: This section use only decks with full knowledge of the Line-Ups. Other decks are excluded
The LMI
is an Index I developed to measure the performance of decks in the metagame. For those who are familiar with basic statistical concept I wrote a document to explain the theory behind it: , it’s very similar to vicioussyndicate (vS) Meta Score from their data reaper report. The score of each deck is not just their “strength”, it takes in consideration both play rates and win rates that’s why I prefer to say it measure the “performance”. The values range from 0 to 100 and the higher the value, the higher is the performance. 2
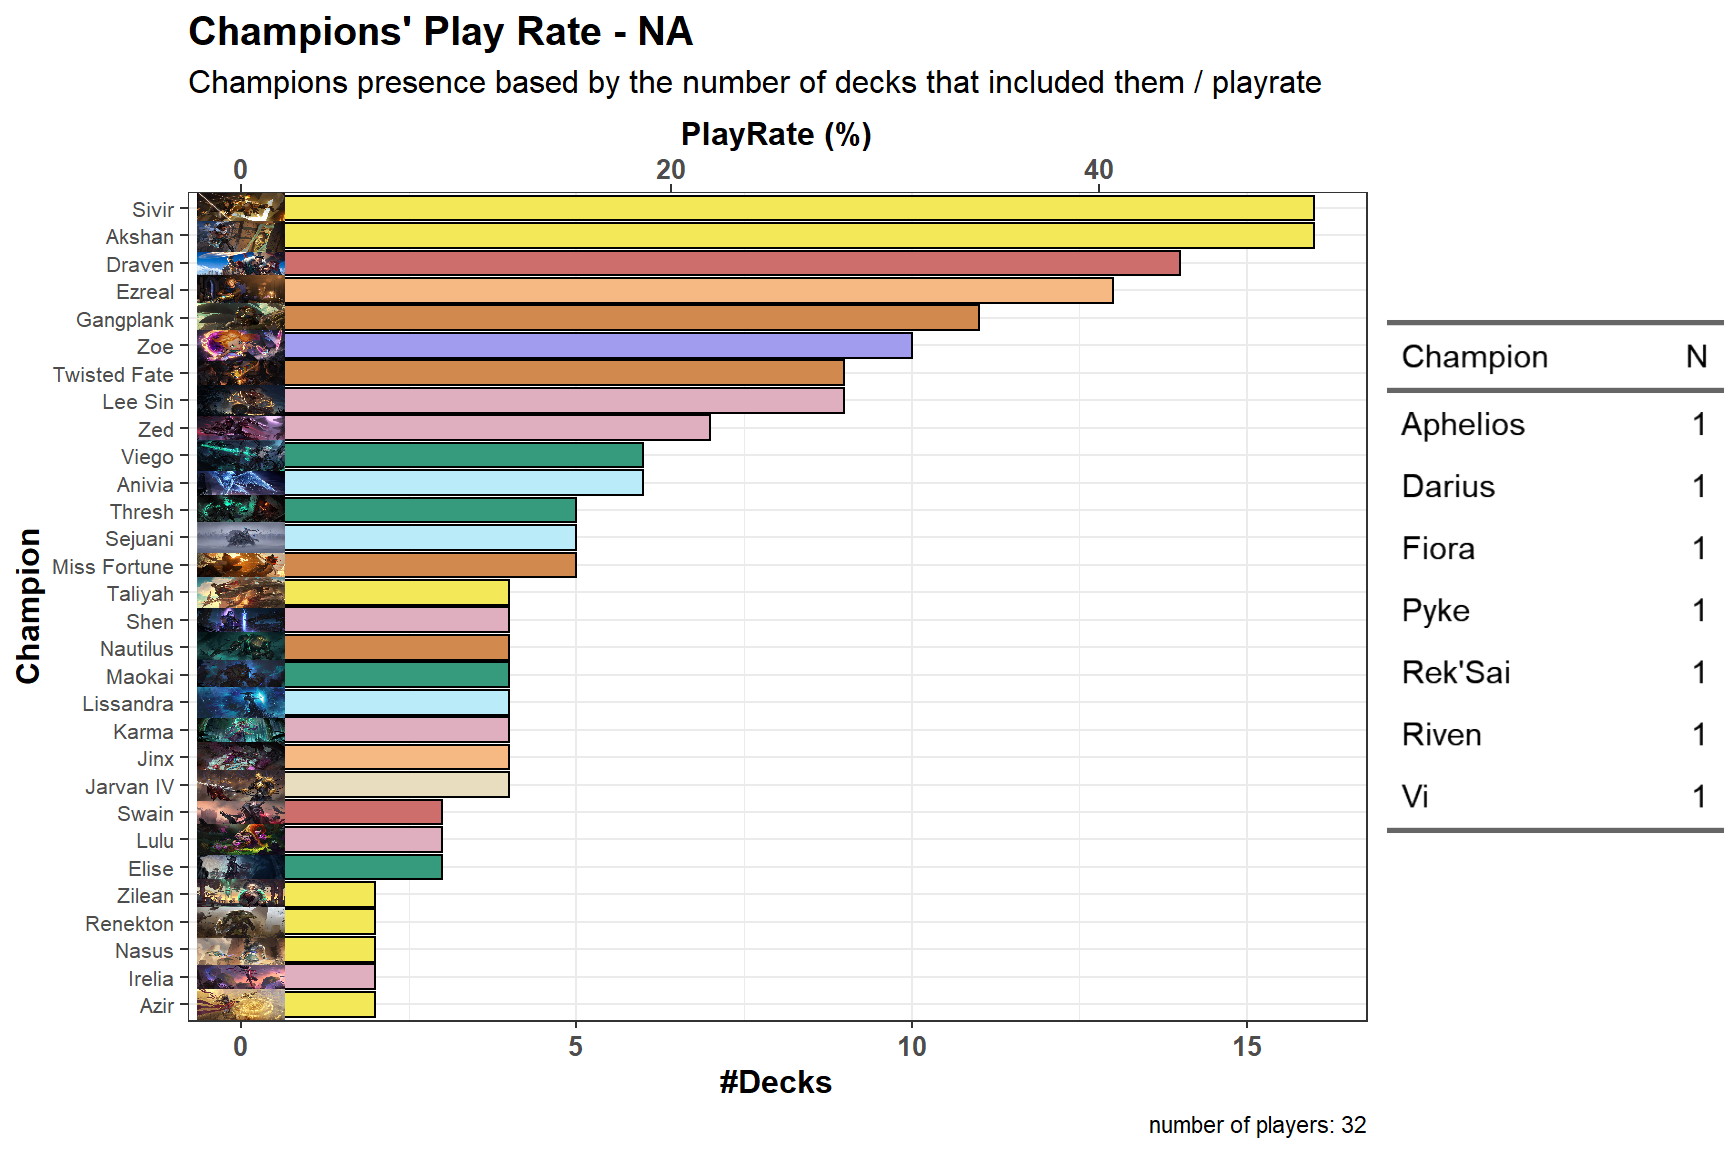
I have the suspect that data suggest Akshan/Sivir (Demacia) is OP.
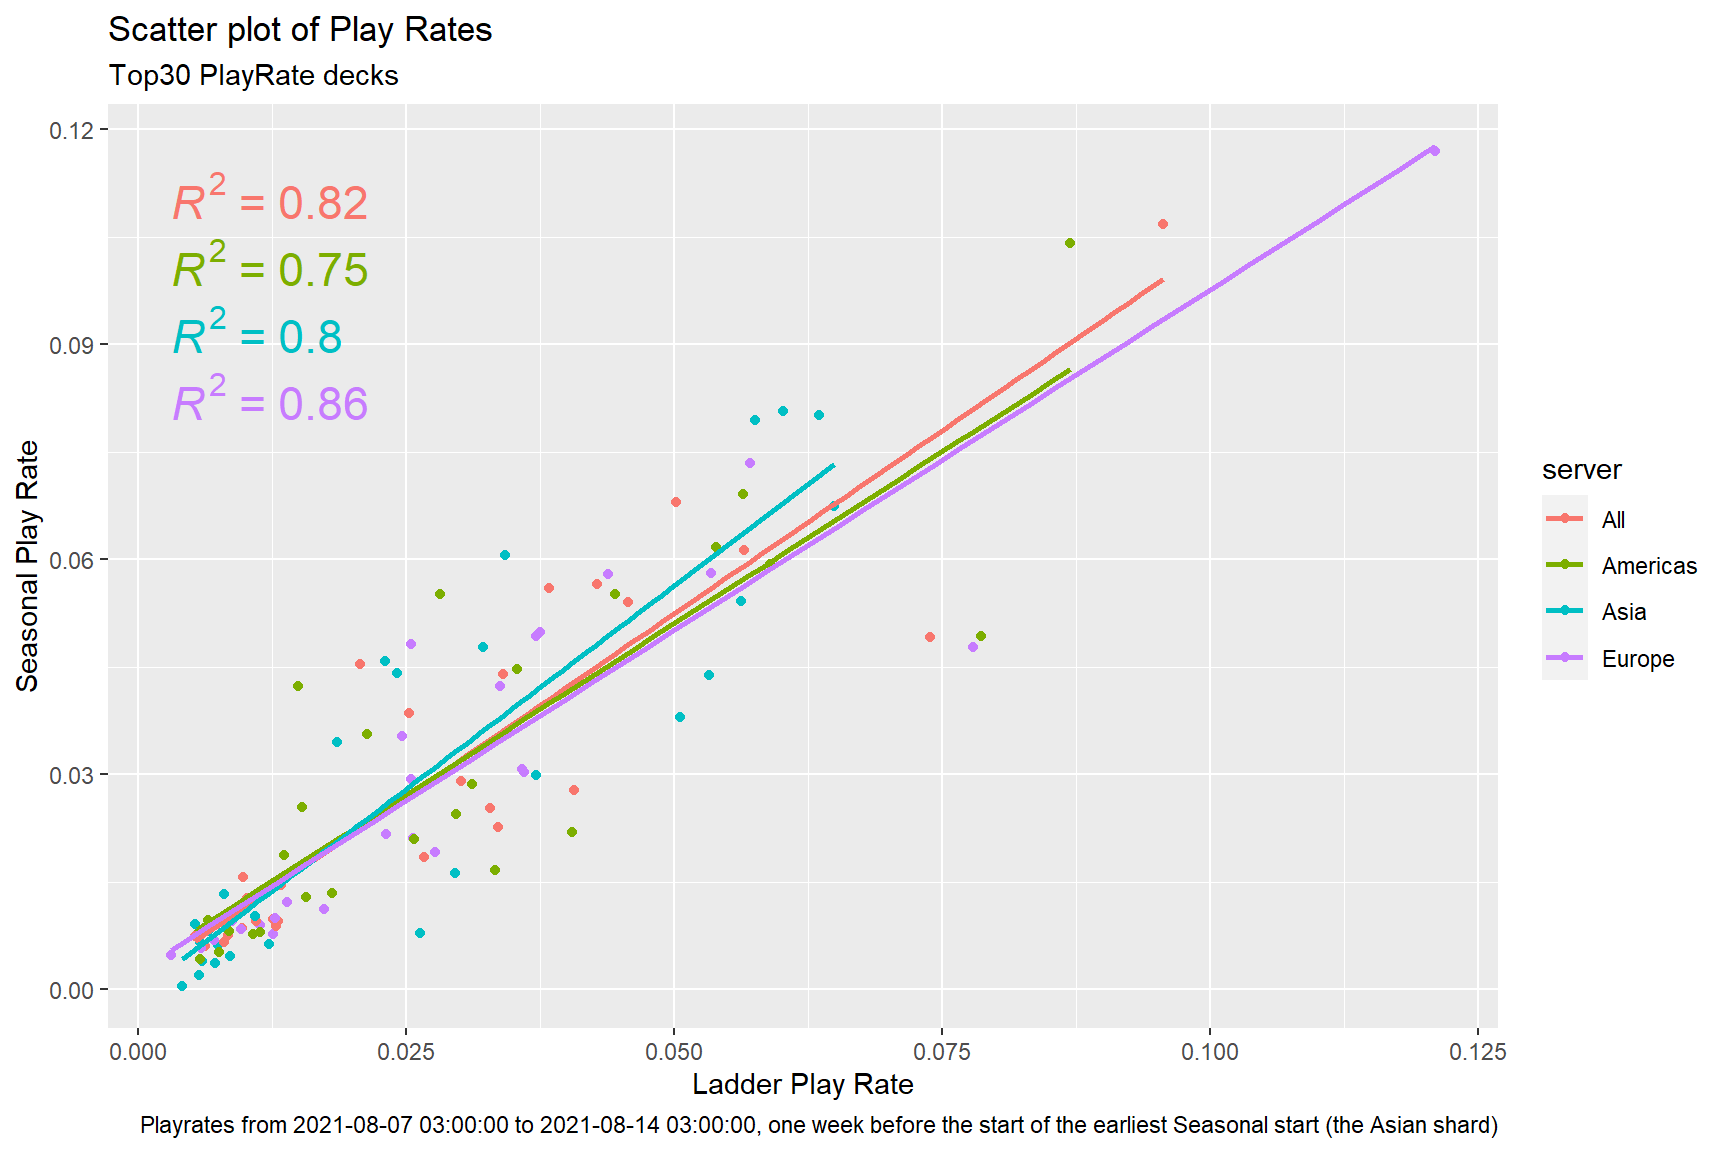
The Meta and the Seasonal
While there certainly exist numerous analysis possible for the Seasonal data right now I don’t have many idea about what to anaylise. But for sure there is still an aspect I was always curious about when I had to see those data: how do they reflect what was the meta right before the tournament?
What does the following graph means? The easy explanation is that the play rate on the ladder is an highly predictive variable of the playrate of a deck during the seasonal? Is it obvious? Not necessirily as there are some decks that performs better in a tournament setting? The R^2 can be read as how much the ladder predict the seasonal. It’s not the “correct interpretation” but this will be left for a more in-depth analysis that would require more effert and theory that is not for everyone. Of course this just a first approximation but in the right context they can already give a good hint about the overall relationship between variables
Legal bla bla
This Meta Report was created under Riot Games’ “Legal Jibber Jabber” policy using assets owned by Riot Games. Riot Games does not endorse or sponsor this project.