Data
Number of (Ranked) games analyzed: 45402
Last Update: 2021-08-26 16:28
| by the Numbers | |
|---|---|
| Patch 2.13 first week / Master players1,2 | |
| Characteristic | N = 107,6093 |
| Status | |
| Other | 58,682 (55%) |
| Ranked | 45,402 (42%) |
| Friendly | 3,525 (3.3%) |
| Server | |
| americas | 53,369 (50%) |
| asia | 10,044 (9.3%) |
| europe | 44,196 (41%) |
|
1
Max datetime recovered: 2021-08-25 14:45:46 UTC from 2021-08-18 21:00:00 to 2021-08-25 21:00:00 UTC
2 EU Master players in the ladder: 0 while number of possible Master players recovered is: 0 NA Master players in the ladder: 1 while number of possible Master players recovered is: 0 ASIA Master players in the ladder: 1 while number of possible Master players recovered is: 1
3
Metadata from Friendly Matches (that aren't Bo3) is not recoverable,
the value may not be perfect since I lack the starting time of the game. The amount of Games to still scrap is also an estimation based on the 'position' of the game
|
|
Regions
Play Rate
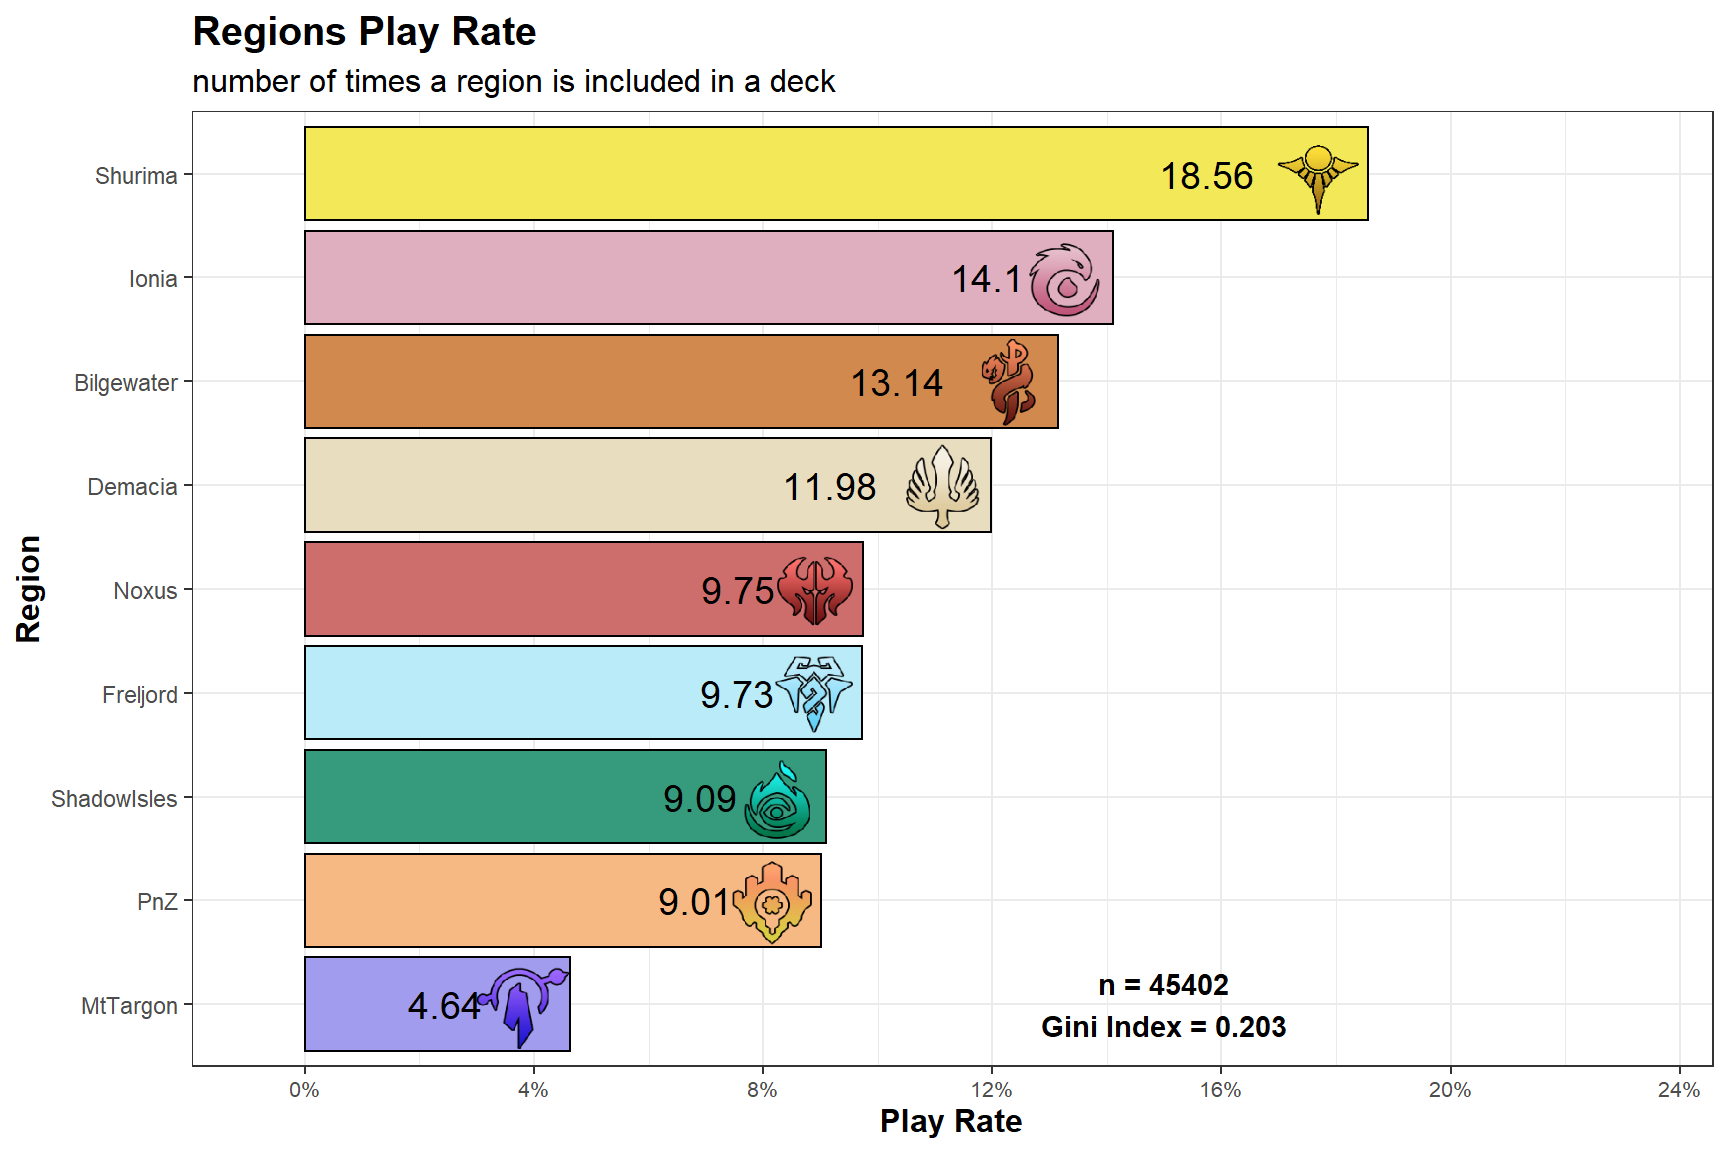
The Gini Index is a measure of heterogeneity so, in this case and in simpler terms, how much the play rates are similar. The Index goes (when normalized like here) in [0,1] and it’s equal to 1 when there’s a single value with 100% play rate or 0 when all play rates are equal. Of course a Gini Index of 1 needs to be avoided but it’s not like the aim should be 0. As said, it’s just to add some additional tools.
| Region Play Rate | ||||
|---|---|---|---|---|
| Relative Frequencies by Inclusion Rate of a Region | ||||
| Region | Freq | Shard | ||
| America | Asia | Europe | ||
| Shurima | 18.56% | 18.61% | 22.02% | 17.61% |
| Ionia | 14.10% | 14.61% | 15.75% | 13.07% |
| Bilgewater | 13.14% | 13.06% | 11.93% | 13.56% |
| Demacia | 11.98% | 11.16% | 13.65% | 12.56% |
| Noxus | 9.75% | 10.44% | 7.10% | 9.58% |
| Freljord | 9.73% | 8.38% | 10.01% | 11.30% |
| ShadowIsles | 9.09% | 8.96% | 8.97% | 9.27% |
| PnZ | 9.01% | 9.98% | 7.51% | 8.21% |
| MtTargon | 4.64% | 4.81% | 3.05% | 4.83% |
Play Rate by number of Cards
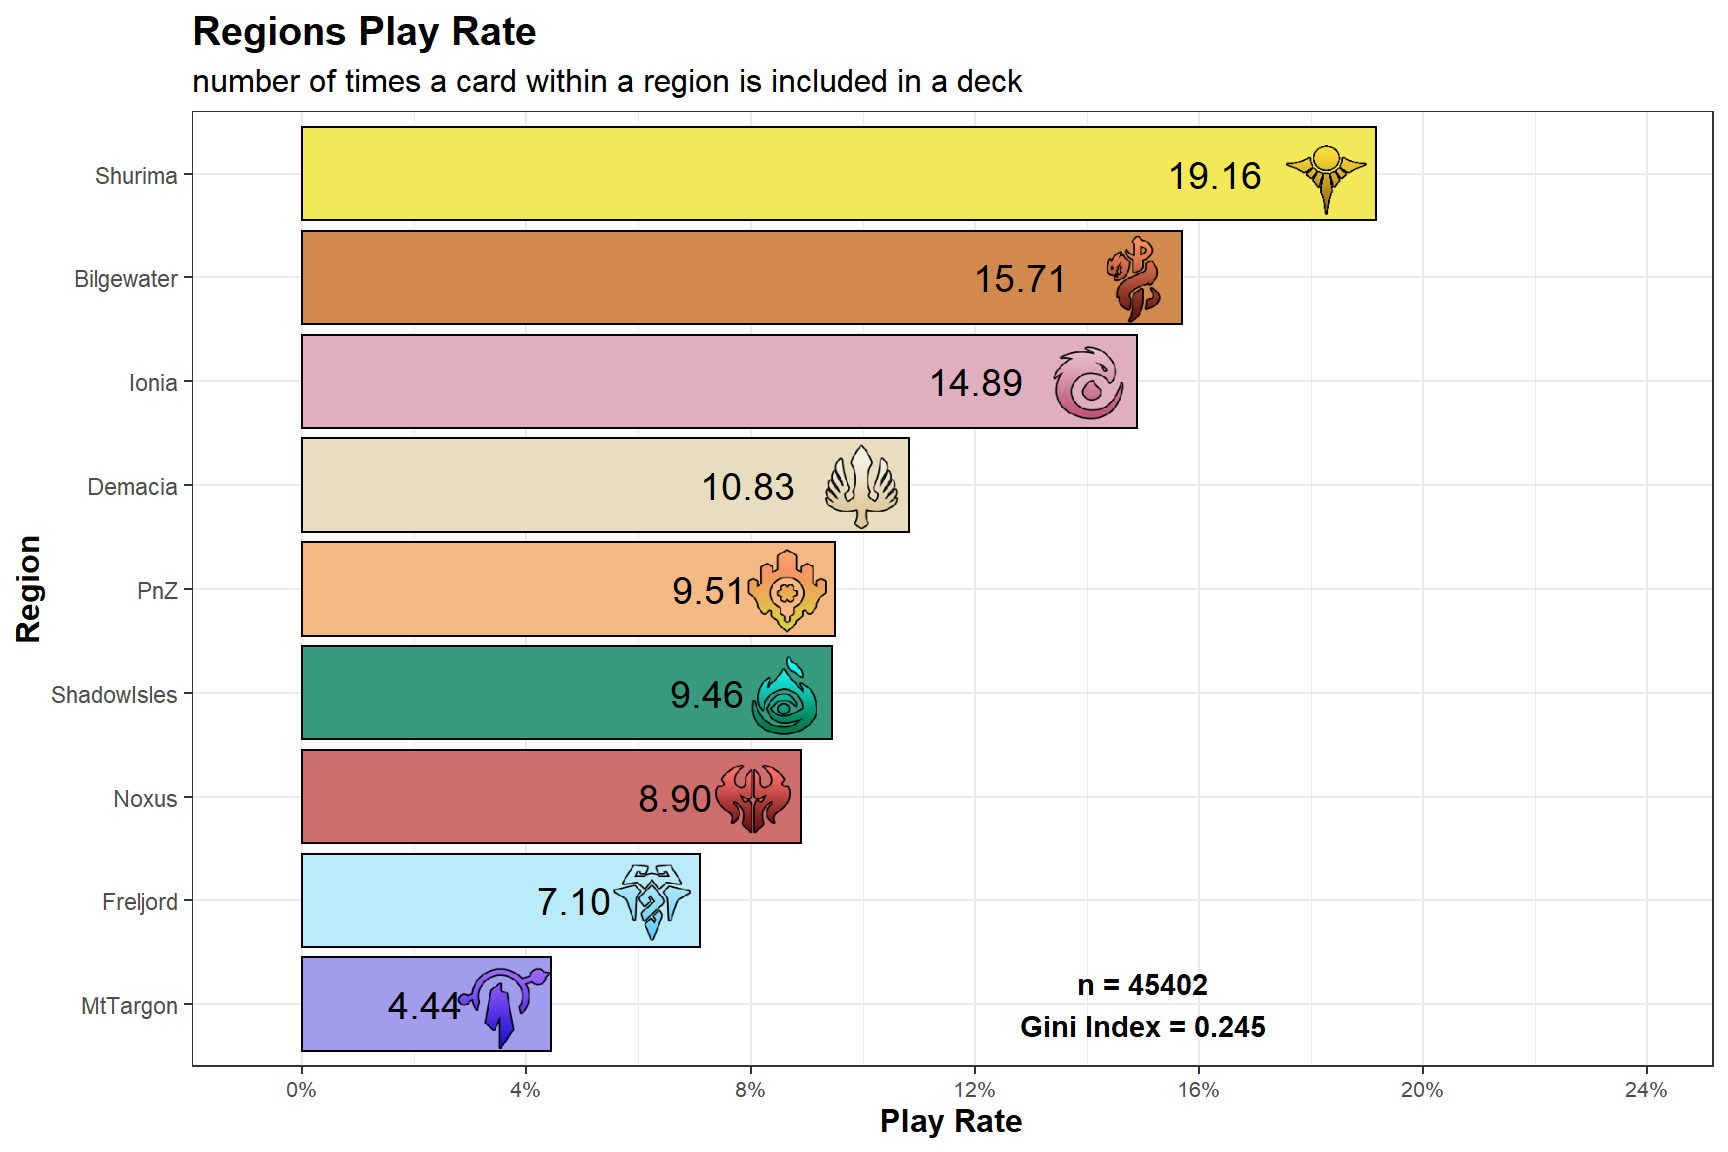
| Region Play Rate | ||||
|---|---|---|---|---|
| Relative Frequencies by number of times a Card within a Region is included in a Deck | ||||
| Region | Freq | Shard | ||
| America | Asia | Europe | ||
| Shurima | 19.16% | 19.00% | 23.23% | 18.31% |
| Bilgewater | 15.71% | 15.14% | 13.97% | 16.85% |
| Ionia | 14.89% | 15.51% | 16.76% | 13.66% |
| Demacia | 10.83% | 10.10% | 11.93% | 11.44% |
| PnZ | 9.51% | 10.52% | 7.80% | 8.71% |
| ShadowIsles | 9.46% | 9.36% | 9.24% | 9.65% |
| Noxus | 8.90% | 9.53% | 6.54% | 8.73% |
| Freljord | 7.10% | 6.19% | 7.72% | 8.04% |
| MtTargon | 4.44% | 4.64% | 2.82% | 4.61% |
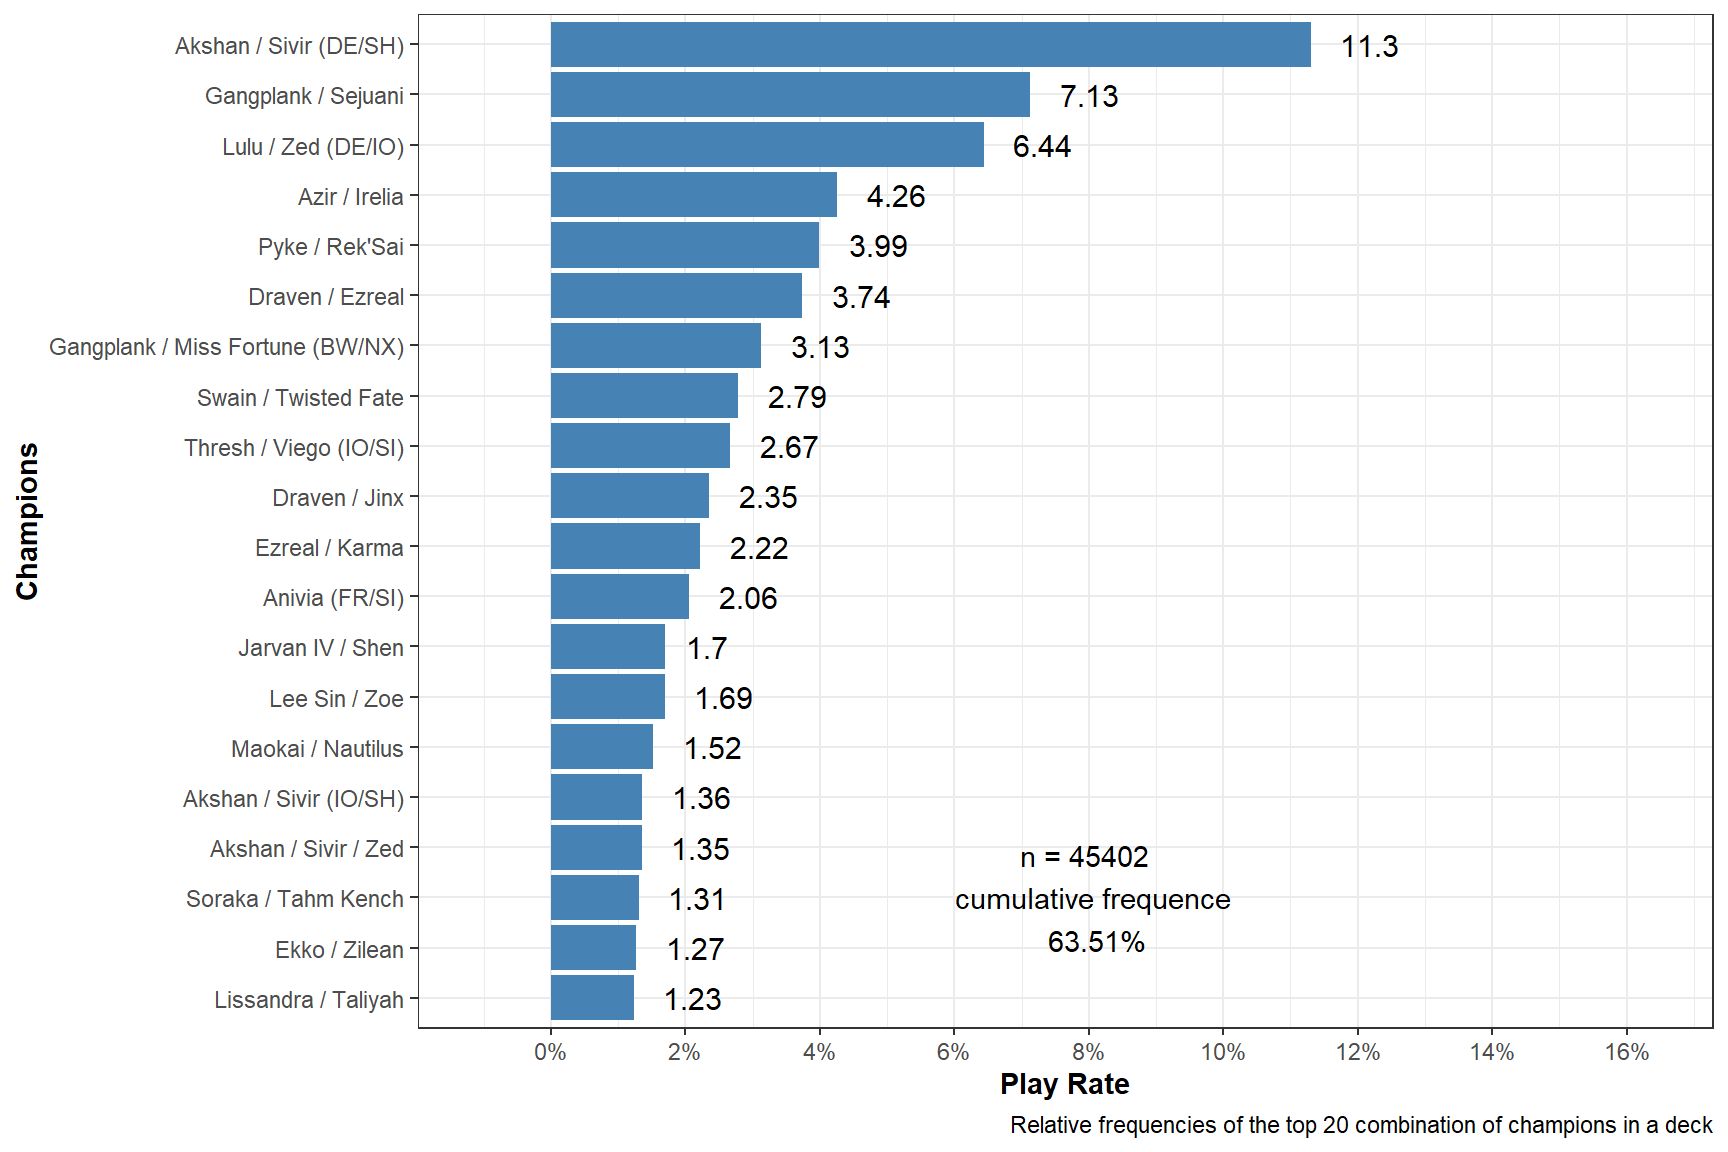
Champions Combinations
Play Rates
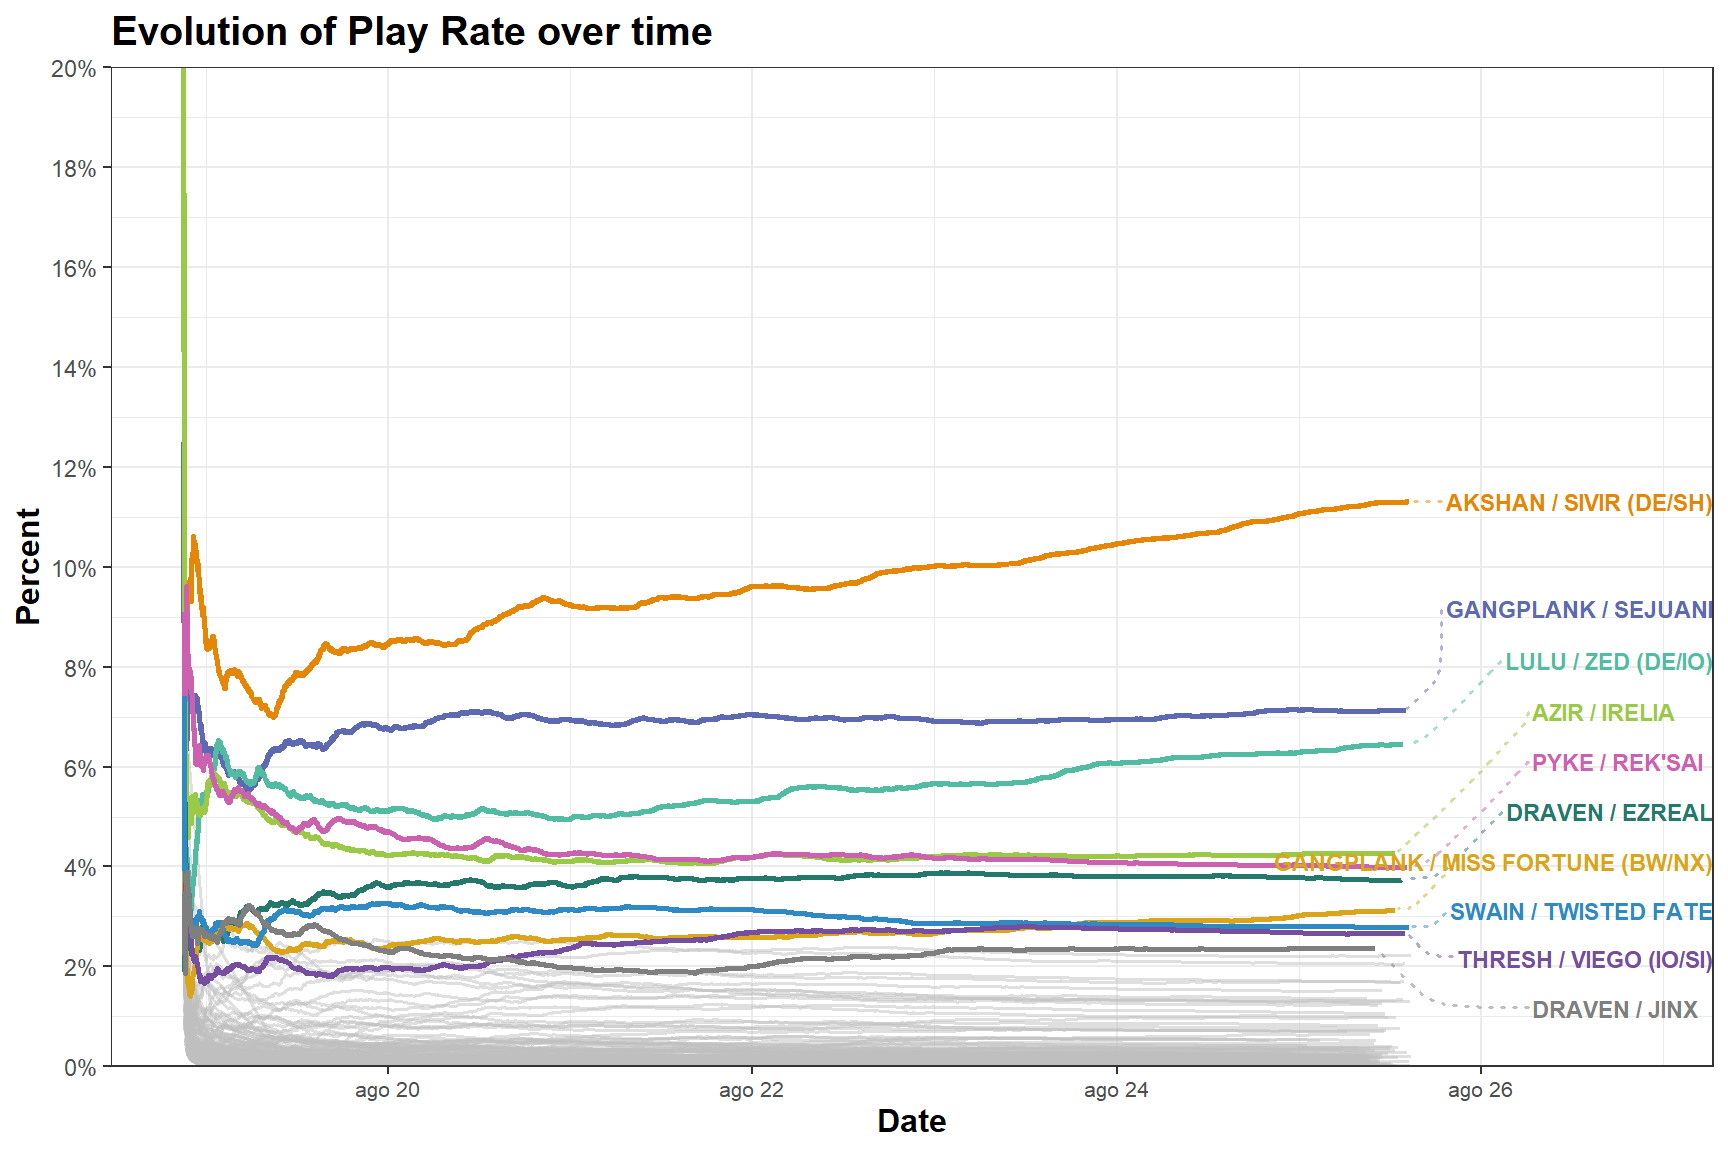
Day by Day
Highlisting the top10 most played decks (at the moment of the last game played).
Win Rates
Tie games are excluded
Win rates of the most played combination of champions. Play Rate >= 1% in at least one of the servers.
Top Win rates of the top10 best performing least played combination of champions. Play rate ∈ [0.1%,1%)
Looking at this week results it’s clear most of these decks can be grouped as ‘Plunder’ decks. I’m working on it, but I’m still far from reaching a quality of the results that satisfy me.
Match Ups
Note : While these are indeed the Match-Ups win-rates that one can extract from last week games I need to point out that this is not the most accurate estimation you can get from my data. If you want a better picture of the current meta it would be better to look at the MU-page where I use all games with the current sets of buffs and nerfs. While it’s that there I don’t account for optimization and difference in skills acquired during the weeks the overall number of games / sample size makes them a much safer source of information. While I’ll continue to release the weekly data, pls refer to the MU - page for a better “meta-investigation”.
The win rates on the grid are among the 15 most played champion combination.
MatchUps | Akshan / Sivir (DE/SH) | Anivia (FR/SI) | Azir / Irelia | Draven / Ezreal | Draven / Jinx | Ezreal / Karma | Gangplank / Miss Fortune (BW/NX) | Gangplank / Sejuani | Jarvan IV / Shen | Lee Sin / Zoe | Lulu / Zed (DE/IO) | Maokai / Nautilus | Pyke / Rek'Sai | Swain / Twisted Fate | Thresh / Viego (IO/SI) |
Akshan / Sivir (DE/SH) | 69% | 66% | 60% | 48% | 73% | 59% | 53% | 62% | 67% | 51% | 60% | 63% | 71% | 62% | |
Anivia (FR/SI) | 31% | 14% | 59% | 81% | 38% | 44% | 54% | 61% | 43% | 53% | 19% | 34% | 60% | 28% | |
Azir / Irelia | 34% | 86% | 40% | 33% | 61% | 34% | 53% | 52% | 63% | 30% | 66% | 47% | 39% | 55% | |
Draven / Ezreal | 40% | 41% | 60% | 59% | 40% | 50% | 40% | 49% | 47% | 63% | 45% | 46% | 57% | 52% | |
Draven / Jinx | 52% | 19% | 67% | 41% | 43% | 55% | 45% | 41% | 40% | 55% | 52% | 60% | 28% | 52% | |
Ezreal / Karma | 27% | 62% | 39% | 60% | 57% | 40% | 38% | 52% | 67% | 68% | 37% | 41% | 58% | 49% | |
Gangplank / Miss Fortune (BW/NX) | 41% | 56% | 66% | 50% | 45% | 60% | 60% | 55% | 57% | 47% | 52% | 56% | 45% | 53% | |
Gangplank / Sejuani | 47% | 46% | 47% | 60% | 55% | 62% | 40% | 61% | 49% | 53% | 52% | 55% | 61% | 45% | |
Jarvan IV / Shen | 38% | 39% | 48% | 51% | 59% | 48% | 45% | 39% | 62% | 65% | 50% | 50% | 47% | 64% | |
Lee Sin / Zoe | 33% | 57% | 37% | 53% | 60% | 33% | 43% | 51% | 38% | 42% | 74% | 51% | 54% | 46% | |
Lulu / Zed (DE/IO) | 49% | 47% | 70% | 37% | 45% | 32% | 53% | 47% | 35% | 58% | 69% | 73% | 31% | 57% | |
Maokai / Nautilus | 40% | 81% | 34% | 55% | 48% | 63% | 48% | 48% | 50% | 26% | 31% | 41% | 42% | 39% | |
Pyke / Rek'Sai | 37% | 66% | 53% | 54% | 40% | 59% | 44% | 45% | 50% | 49% | 27% | 59% | 51% | 57% | |
Swain / Twisted Fate | 29% | 40% | 61% | 43% | 72% | 42% | 55% | 39% | 53% | 46% | 69% | 57% | 49% | 44% | |
Thresh / Viego (IO/SI) | 38% | 72% | 45% | 48% | 48% | 51% | 47% | 55% | 36% | 54% | 43% | 61% | 43% | 56% |
Deck Structure of the week
LoR-Meta Index (LMI)
The LMI
is an Index I developed to measure the performance of decks in the metagame. For those who are familiar with basic statistical concept I wrote a document to explain the theory behind it: , it’s very similar to vicioussyndicate (vS) Meta Score from their data reaper report. The score of each deck is not just their “strength”, it takes in consideration both play rates and win rates that’s why I prefer to say it measure the “performance”. The values range from 0 to 100 and the higher the value, the higher is the performance. 3
Cards Presence
It seems that not even Twin Disciple can beat Sharsight
Cards that couldn’t find place even in a meme deck.
| Region | Demacia | Ionia | PnZ | ShadowIsles |
| 1 | Silverwing Diver | Nimble Poro | Unstable Voltician | Sinister Poro |
| 2 | Stalking Broodmother | Sown Seeds | Tortured Prodigy | |
| 3 | Shadow Flare |
Legal bla bla
This Meta Report was created under Riot Games’ “Legal Jibber Jabber” policy using assets owned by Riot Games. Riot Games does not endorse or sponsor this project.