Data
Number of (Ranked) games analyzed: 73643
Last Update: 2021-08-11 22:24 1
| by the Numbers | |
|---|---|
| Patch 2.13 first week / Master players1,2 | |
| Characteristic | N = 177,8023 |
| Status | |
| Other | 76,765 (43%) |
| Ranked | 73,643 (41%) |
| to Scrap | 23,773 (13%) |
| Friendly | 3,621 (2.0%) |
| Server | |
| americas | 80,139 (45%) |
| asia | 30,262 (17%) |
| europe | 67,401 (38%) |
|
1
Max datetime recovered: 2021-08-11 17:17:25 UTC from 2021-08-04 21:00:00 to 2021-08-11 21:00:00 UTC
2 EU Master players in the ladder: 1229 while number of possible Master players recovered is: 1222 NA Master players in the ladder: 1396 while number of possible Master players recovered is: 1394 ASIA Master players in the ladder: 498 while number of possible Master players recovered is: 500
3
Metadata from Friendly Matches (that aren't Bo3) is not recoverable,
the value may not be perfect since I lack the starting time of the game. The amount of Games to still scrap is also an estimation based on the 'position' of the game
|
|
Regions
Play Rate
Plot
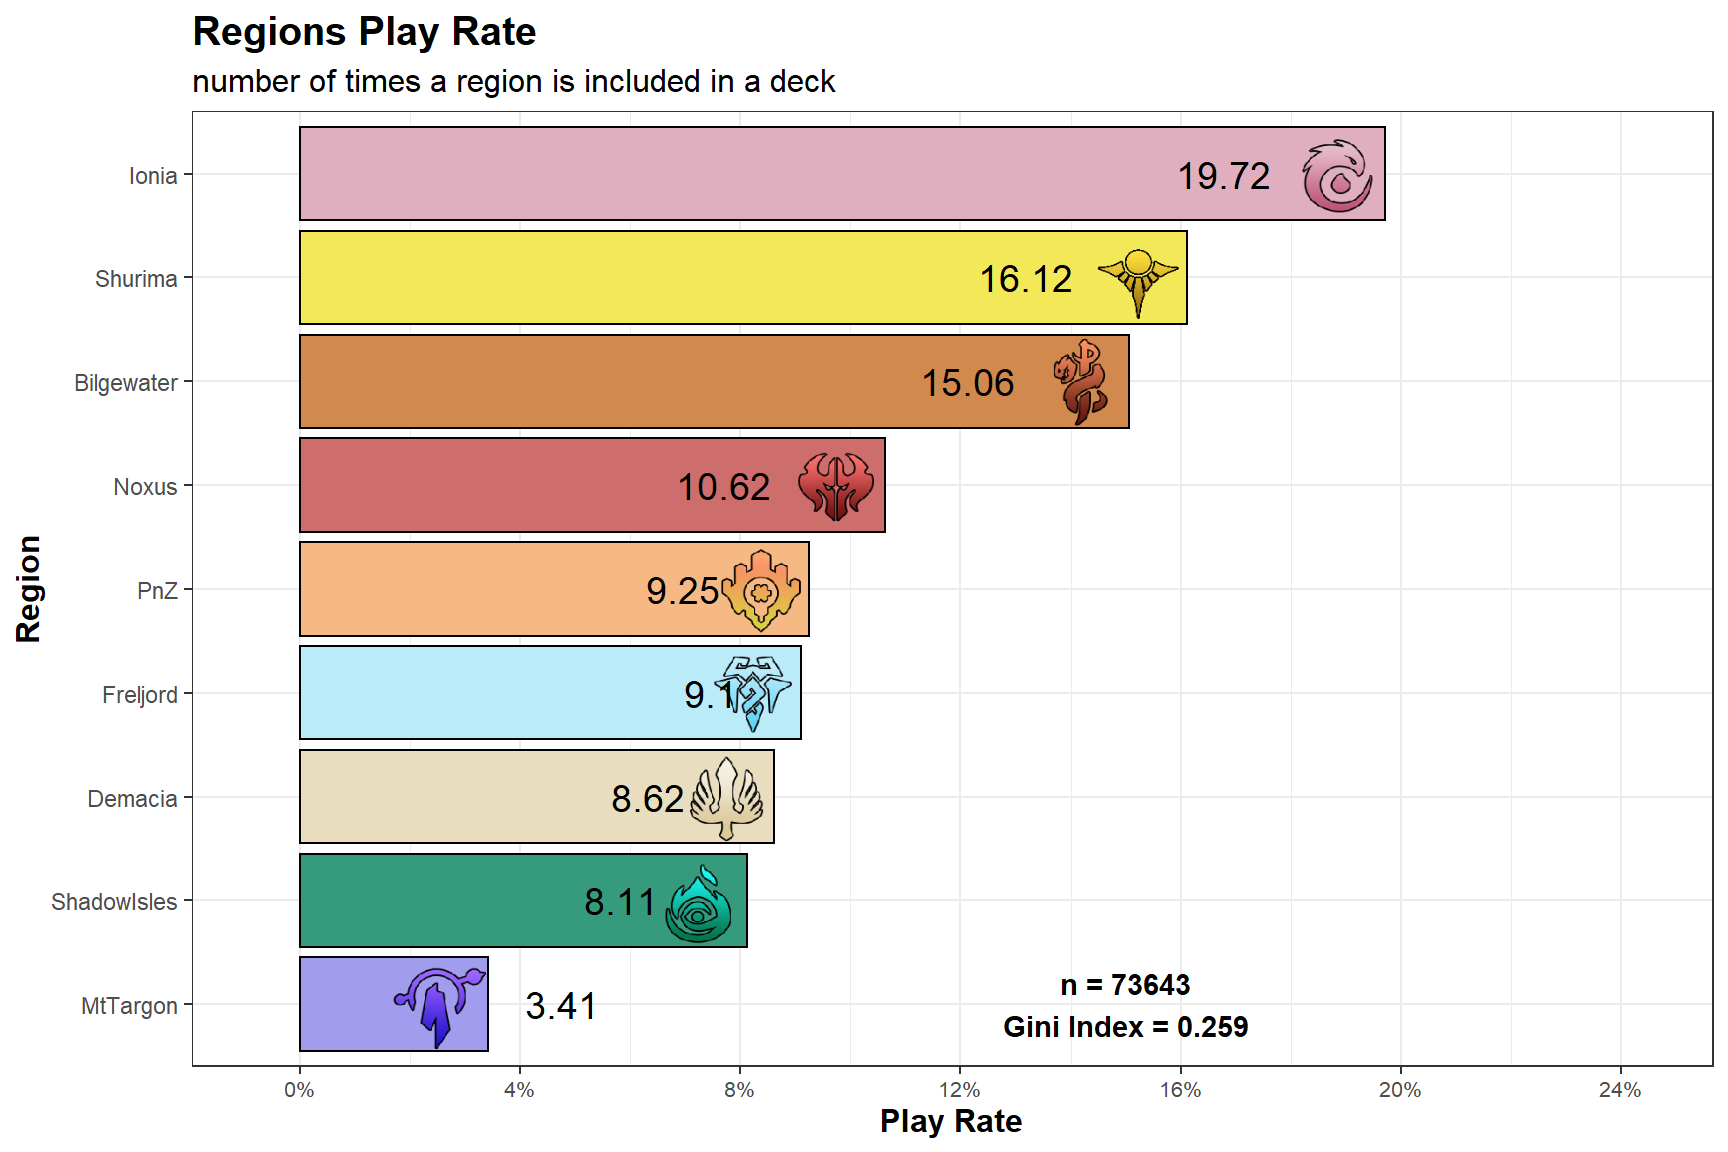
The Gini Index is a measure of heterogeneity so, in this case and in simpler terms, how much the play rates are similar. The Index goes (when normalized like here) \(in\) [0,1] and it’s equal to 1 when there’s a single value with 100% play rate or 0 when all play rates are equal. Of course a Gini Index of 1 needs to be avoided but it’s not like the aim should be 0. As said, it’s just to add some additional tools.
Table
| Region Play Rate | ||||
|---|---|---|---|---|
| Relative Frequencies by Inclusion Rate of a Region | ||||
| Region | Freq | Shard | ||
| America | Asia | Europe | ||
| Ionia | 19.72% | 18.97% | 20.17% | 20.28% |
| Shurima | 16.12% | 16.09% | 18.11% | 15.10% |
| Bilgewater | 15.06% | 15.58% | 13.40% | 15.39% |
| Noxus | 10.62% | 11.00% | 9.55% | 10.78% |
| PnZ | 9.25% | 9.49% | 8.94% | 9.15% |
| Freljord | 9.10% | 8.79% | 9.34% | 9.31% |
| Demacia | 8.62% | 8.30% | 8.29% | 9.13% |
| ShadowIsles | 8.11% | 8.09% | 9.08% | 7.62% |
| MtTargon | 3.41% | 3.69% | 3.14% | 3.24% |
Play Rate by number of Cards
Plot
Table
| Region Play Rate | ||||
|---|---|---|---|---|
| Relative Frequencies by number of times a Card within a Region is included in a Deck | ||||
| Region | Freq | Shard | ||
| America | Asia | Europe | ||
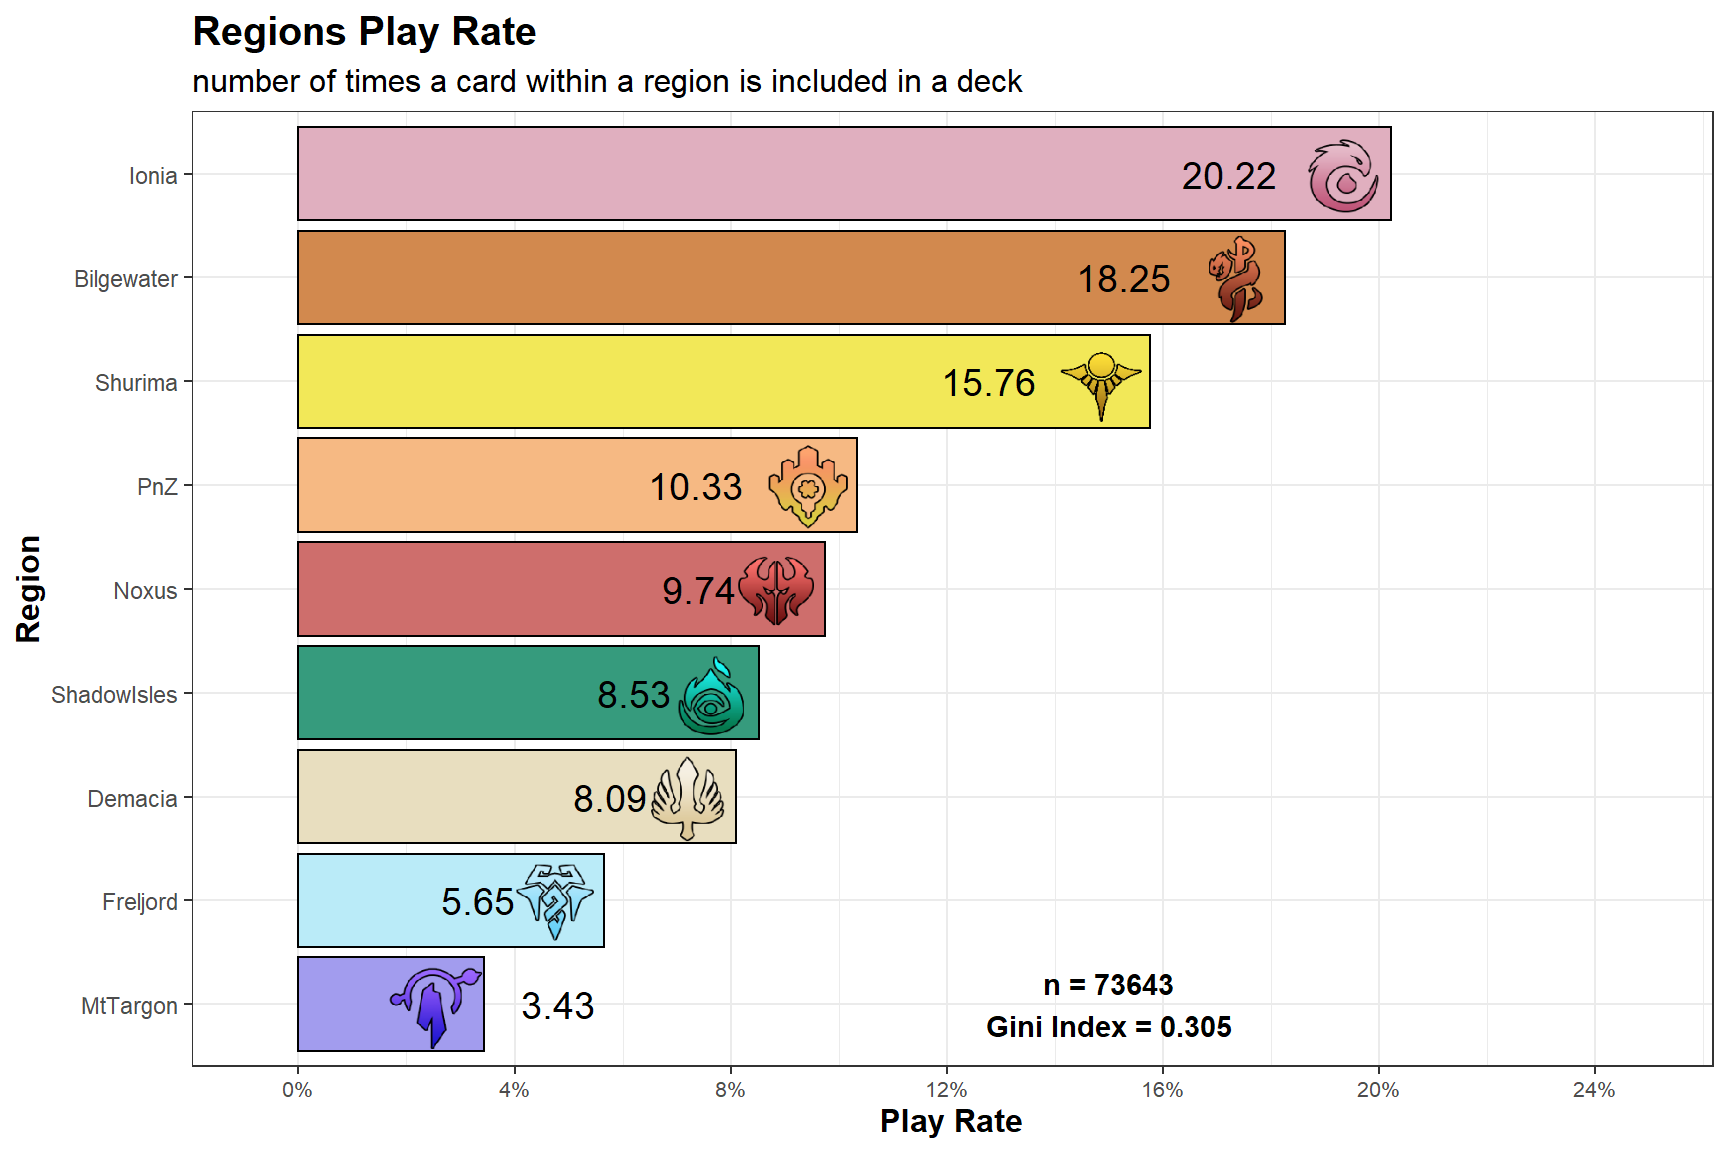
| Ionia | 20.22% | 19.63% | 20.25% | 20.85% |
| Bilgewater | 18.25% | 18.75% | 15.08% | 19.40% |
| Shurima | 15.76% | 15.75% | 18.09% | 14.52% |
| PnZ | 10.33% | 10.55% | 9.92% | 10.32% |
| Noxus | 9.74% | 10.18% | 8.63% | 9.87% |
| ShadowIsles | 8.53% | 8.15% | 9.93% | 8.19% |
| Demacia | 8.09% | 7.79% | 7.90% | 8.52% |
| Freljord | 5.65% | 5.42% | 7.12% | 5.12% |
| MtTargon | 3.43% | 3.78% | 3.09% | 3.22% |
Note: This was an usual week regarding the Regions’ play rates. There is a bigger discrepancy compared to usual between the values obtained by inclusion rate or counting the number of cards for each region. Most notably are Freljord being chosen as a region a decent amount of times but the cards being present in a much lower amount. On the other hand we have the opposite for Bilgewater suggesting an increase of decks that tend do the alligiance cases (Pluder?).
Champions Combinations
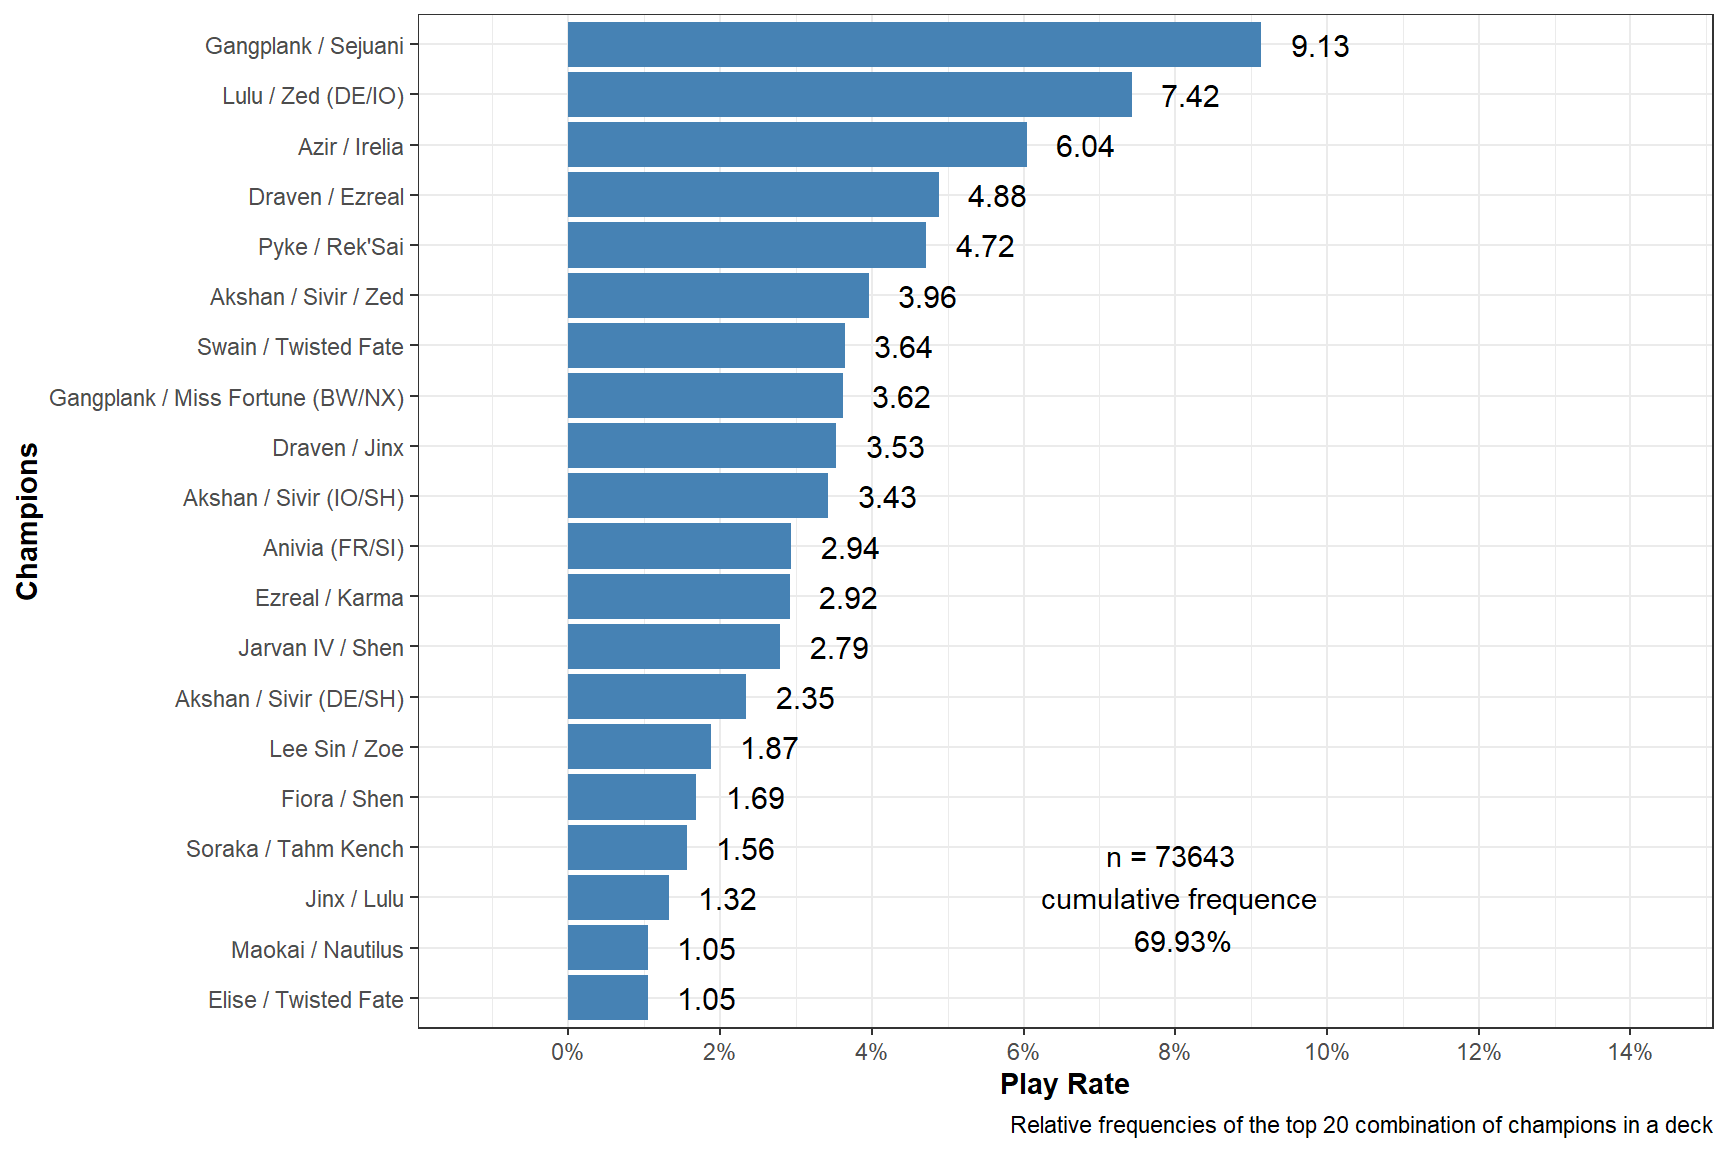
Play Rates
Note: I’m currently not sure if I shuld add the Gini Index for Champions too. There are currently too many cases with many decks that are bound so have near 0 play rate.
Plot
Table
Day by Day
Highlisting the top10 most played decks (at the moment of the last game played).
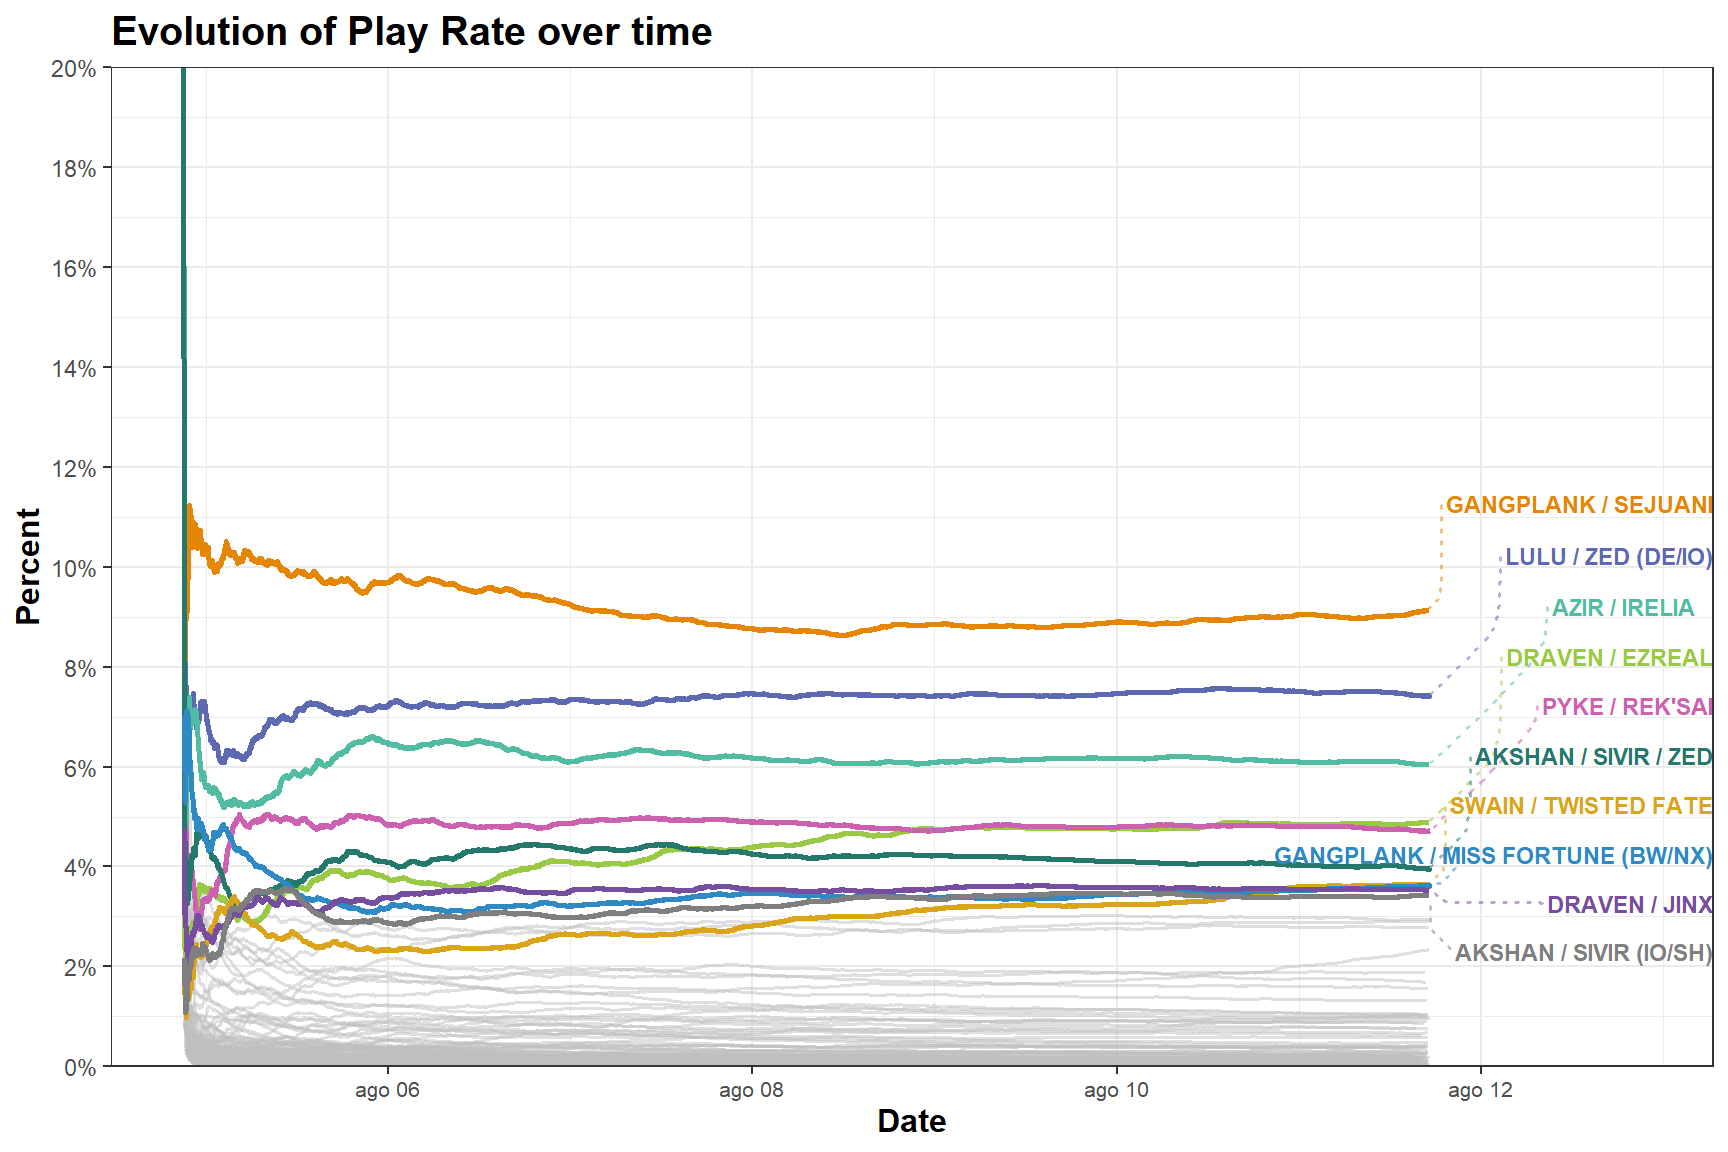
Note: It’s a bit surprising that Lulu/Zed was able to rank-up to the second most played deck in such low time.
Akshan/Sivir/Zed seems to be confirmed as the “Sivir deck of choice” and Draven/Ezreal continue to rise as the “anti-random” decks near a seasonal, if it works why change it afterall.
Overall no real surprised as the meta was stabilizing from almost two weeks, most of the differences can be explained by how there is no tier0 and lower-tier (in playrate) meta-decks are more neck to neck and able to push the overall results in different directions.
Win Rates
Tie games are excluded
Meta Decks
Win rates of the most played combination of champions. Play Rate >= 1% in at least one of the servers.
Underdog
Top Win rates of the top10 best performing least played combination of champions. Play rate \(\in\) [0.1%,1%)2
Since I added the server-specific values it would have been wrong to ignore this also in this ‘Underdog’ section. I decided to leave the rule untouched, without taking in account the different servers. While for the “Meta Decks” it was more a natural expansion, here the results can widely differ by small changed and as mentioned in the past I would like to leave the current rule as much as possible unless it’s too broken. Of course one could complain as there decks whose results are mostly carried by a single server and/or not even played in the others.
All true, but there are limitation like the facrs that the asian server is very low on number during all the season so even the condition of a mininum of 50 games with playrate \(\in\) [0.1%,1%) is a lot screw the results. Also this section in not as the Meta Deck one where players are interested in seeing the performance of the most played decks but it’s meant to be a “look around there may be some dark tech that’s worth investing some time”.
A better solution would be ‘expanding’ this section or providing some tools to allows players to search the result. But there’s a problem, not providing immediate readable results and leave the research to the user is a bad choice in a report from my point of view at least and for sections like this one in particular. It could be worth exploring as a standalone option like the recently uploaded page for the MU table (MU-Table)
Looking at this week results it’s clear most of these decks can be grouped as ‘Plunder’ decks. I’m working on it, but I’m still far from reaching a quality of the results that satisfy me.
Match Ups
Note 1: Since the MU table required a little more space and I wanted to give the same amoutnt for the table (for uniformity) I can add a few decks to the grid covering the top15 mostplayed archetypes
Note 2: While these are indeed the Match-Ups win-rates that one can extract from last week games I need to point out that this is not the most accurate estimation you can get from my data. If you want a better picture of the current meta it would be better to look at the MU-page where I use all games with the current sets of buffs and nerfs. While it’s that there I don’t account for optimization and difference in skills acquired during the weeks the overall number of games / sample size makes them a much safer source of information. While I’ll continue to release the weekly data, pls refer to the MU - page for a better “meta-investigation”.
Match-up Grid
The win rates on the grid are among the 15 most played champion combination.
MatchUps | Akshan / Sivir (DE/SH) | Akshan / Sivir (IO/SH) | Akshan / Sivir / Zed | Anivia (FR/SI) | Azir / Irelia | Draven / Ezreal | Draven / Jinx | Ezreal / Karma | Gangplank / Miss Fortune (BW/NX) | Gangplank / Sejuani | Jarvan IV / Shen | Lee Sin / Zoe | Lulu / Zed (DE/IO) | Pyke / Rek'Sai | Swain / Twisted Fate |
Akshan / Sivir (DE/SH) | 39% | 48% | 70% | 59% | 61% | 47% | 72% | 58% | 64% | 54% | 66% | 44% | 62% | 67% | |
Akshan / Sivir (IO/SH) | 61% | 55% | 63% | 53% | 60% | 47% | 64% | 56% | 49% | 37% | 54% | 34% | 51% | 55% | |
Akshan / Sivir / Zed | 52% | 45% | 48% | 47% | 51% | 41% | 57% | 47% | 51% | 44% | 51% | 36% | 55% | 48% | |
Anivia (FR/SI) | 30% | 37% | 52% | 16% | 70% | 76% | 28% | 63% | 57% | 64% | 50% | 55% | 45% | 66% | |
Azir / Irelia | 41% | 47% | 53% | 84% | 38% | 27% | 68% | 36% | 61% | 47% | 67% | 26% | 49% | 37% | |
Draven / Ezreal | 39% | 40% | 49% | 30% | 62% | 53% | 38% | 49% | 43% | 57% | 45% | 66% | 53% | 53% | |
Draven / Jinx | 53% | 53% | 59% | 24% | 73% | 47% | 38% | 59% | 44% | 46% | 36% | 57% | 58% | 28% | |
Ezreal / Karma | 28% | 36% | 43% | 72% | 32% | 62% | 62% | 59% | 33% | 40% | 72% | 65% | 51% | 49% | |
Gangplank / Miss Fortune (BW/NX) | 42% | 44% | 53% | 37% | 64% | 51% | 41% | 41% | 57% | 47% | 51% | 44% | 60% | 52% | |
Gangplank / Sejuani | 36% | 51% | 49% | 43% | 39% | 57% | 56% | 67% | 43% | 62% | 48% | 47% | 52% | 53% | |
Jarvan IV / Shen | 46% | 63% | 56% | 36% | 53% | 43% | 54% | 60% | 53% | 38% | 49% | 61% | 46% | 39% | |
Lee Sin / Zoe | 34% | 46% | 49% | 50% | 33% | 55% | 64% | 28% | 49% | 52% | 51% | 46% | 51% | 56% | |
Lulu / Zed (DE/IO) | 56% | 66% | 64% | 45% | 74% | 34% | 43% | 35% | 56% | 53% | 39% | 54% | 69% | 32% | |
Pyke / Rek'Sai | 38% | 49% | 45% | 55% | 51% | 47% | 42% | 49% | 40% | 48% | 54% | 49% | 31% | 49% | |
Swain / Twisted Fate | 33% | 45% | 52% | 34% | 63% | 47% | 72% | 51% | 48% | 47% | 61% | 44% | 68% | 51% |
Match-up Table
Deck Structure of the week
Maokai / Viego / ver.Ionia
Maokai / Viego / ver.Shruima
How to read the table:
- Play rate: How often a card is included in this class of decks / the table is order by this column.
- 3/2/1 is the relative and absolute frequency of the number of copies in the decks that plays them
- Frequencies from 50% to 100% are colored from shades of green to white to identify more easily the highest values
LoR-Meta Index (LMI)
The LMI 3 is an Index I developed to measure the performance of decks in the metagame. For those who are familiar with basic statistical concept I wrote a document to explain the theory behind it: , it’s very similar to vicioussyndicate (vS) Meta Score from their data reaper report. The score of each deck is not just their “strength”, it takes in consideration both play rates and win rates that’s why I prefer to say it measure the “performance”. The values range from 0 to 100 and the higher the value, the higher is the performance.
Cards Presence
Play Rate
It seems that not even Twin Disciple can beat Sharsight
Top 3 Play Rates by Region
Forgotten Cards
Cards that couldn’t find place even in a meme deck.
| Region | Freljord | Ionia | MtTargon | Noxus | PnZ | Shurima | ShadowIsles |
| 1 | Entomb | Sown Seeds | Fledgling Stellacorn | Trifarian Shieldbreaker | Eminent Benefactor | Destined Poro | Iron Harbinger |
| 2 | Shadow Flare | Amateur Aeronaut | Waking Sands | Stirred Spirits |
Legal bla bla
This Meta Report was created under Riot Games’ “Legal Jibber Jabber” policy using assets owned by Riot Games. Riot Games does not endorse or sponsor this project.
Reminding that while I may collect the ‘list of all games-id’ played in a certain timeframe I can only collect all their metadata several hours later. So after the first release the numbers may be updated later during the week, be it for the sake of updating or modifying some code.↩︎
Min number of games 50, during the times a meta/ladder just changed.↩︎